
Who’s Selling, Who’s Stalling? The Real Story Behind Toronto’s Listings
As we enter the final stretch of 2025, one challenge stands out above all: convincing sellers to price their homes for today’s market. Too many listings remain anchored to a past that no longer exists. We’re in Fall 2025, not Spring 2022.
Last month, I highlighted four key market indicators: the Home Price Index (HPI), Sales-to-New-Listings Ratio (SNLR), Months of Inventory (MoI), and Sale-to-List Price Ratio (SP/LP). Together, they provide a grounded way for sellers and buyers to shape pricing and offer strategies.
As always, the data speaks volumes. In September, Toronto homes averaged 99% of the list price. Narrow that to $2M–$5M, and it falls to 98%. Over $5M, it drops again to 96%. And at the very top, of the 10 homes sold above $10M this year, the average sale price was just 90% of list. These are indicative of motivated sellers, those willing to adjust on their price and terms to get a deal done.
But remember those figures only reflect the homes that sold. What about the ones that didn’t? For this, we turn to another tool: The Active Listings Waterfall.
The Active Listings Waterfall
The Active Listings Waterfall tracks how the pool of homes for sale shifts over time. We start with the inventory at the beginning of a period, add new listings, and then subtract those that leave the market, whether through sales, expirations, terminations, or suspensions. What remains is the active supply at an end point in time.
This tool highlights three critical dynamics:
-
Market Flow: How much new supply enters vs. how much is cleared.
-
Absorption: Are removals happening because homes sold, or because sellers pulled them off the market?
-
Momentum: Does shrinking inventory come from strong demand or from sellers calling it quits?
Toronto’s Story in 2025
Here’s what the Waterfall shows us about the City of Toronto (416) through the first three quarters of 2025:
-
Start of 2025: 6,300 homes on the market.
-
Year-to-date New Listings: Over 57,000 properties have been brought to market.
-
October 2025: 10,500 homes remain on market.
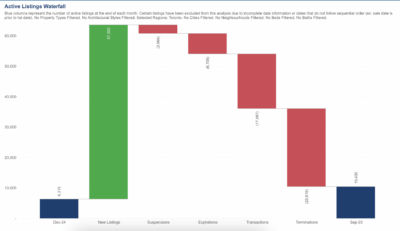
So how did 63,300 homes for sale in 2025 shrink to just 10,500 active listings in October? The answer should be a wake-up call to anyone considering listing their home.
Of the 53,000+ homes in Toronto that left the MLS this year, fewer than 18,000 were due to a sale. The other 35,000+ listings were terminated, expired, or suspended. Put simply: just one-third sold, and two-thirds failed to reach the finish line.
This is what happens when list prices don’t align with market reality. Two times out of three, the home doesn’t sell, which wastes time and erodes the home’s value in a rapidly shifting market.
The Takeaway
In 2025, most listings are not selling, and pricing is the culprit. Sellers who “test the market” at yesterday’s values will likely find themselves in the two-thirds who cancel their listing, often losing money in the process.
For sellers, the path is clear: price in line with today’s market and land in the one-third that sells. For buyers, the Waterfall reveals another truth: much of the inventory you see isn’t priced to sell. Educate yourself so that you can tell the difference.
Looking Ahead
The Active Listings Waterfall is more than another statistic. It shows the hidden story of the listings that never sold. In my experience, an overpriced home doesn’t just sit unsold, it lingers. Time drags, carrying opportunity costs, while market leverage shifts to the buyer.
The lesson? Trust the numbers. Use today’s data to forecast tomorrow’s results. Sellers who adjust early don’t just sell, they protect their bottom line.
At Harvey Kalles Real Estate, we rely on the best data analysis to educate both buyers and sellers. If you’re planning a move or a purchase, call us. We’ll help you make informed decisions with clarity and confidence.