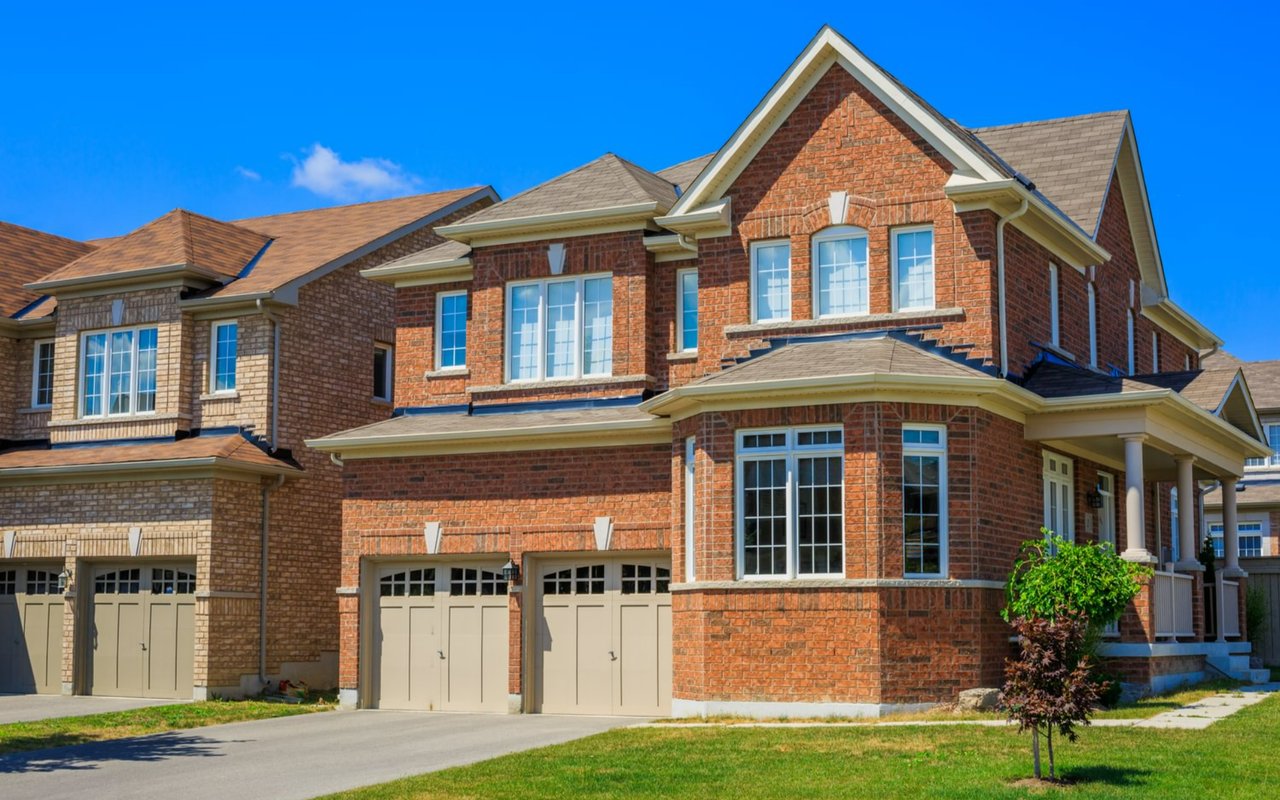
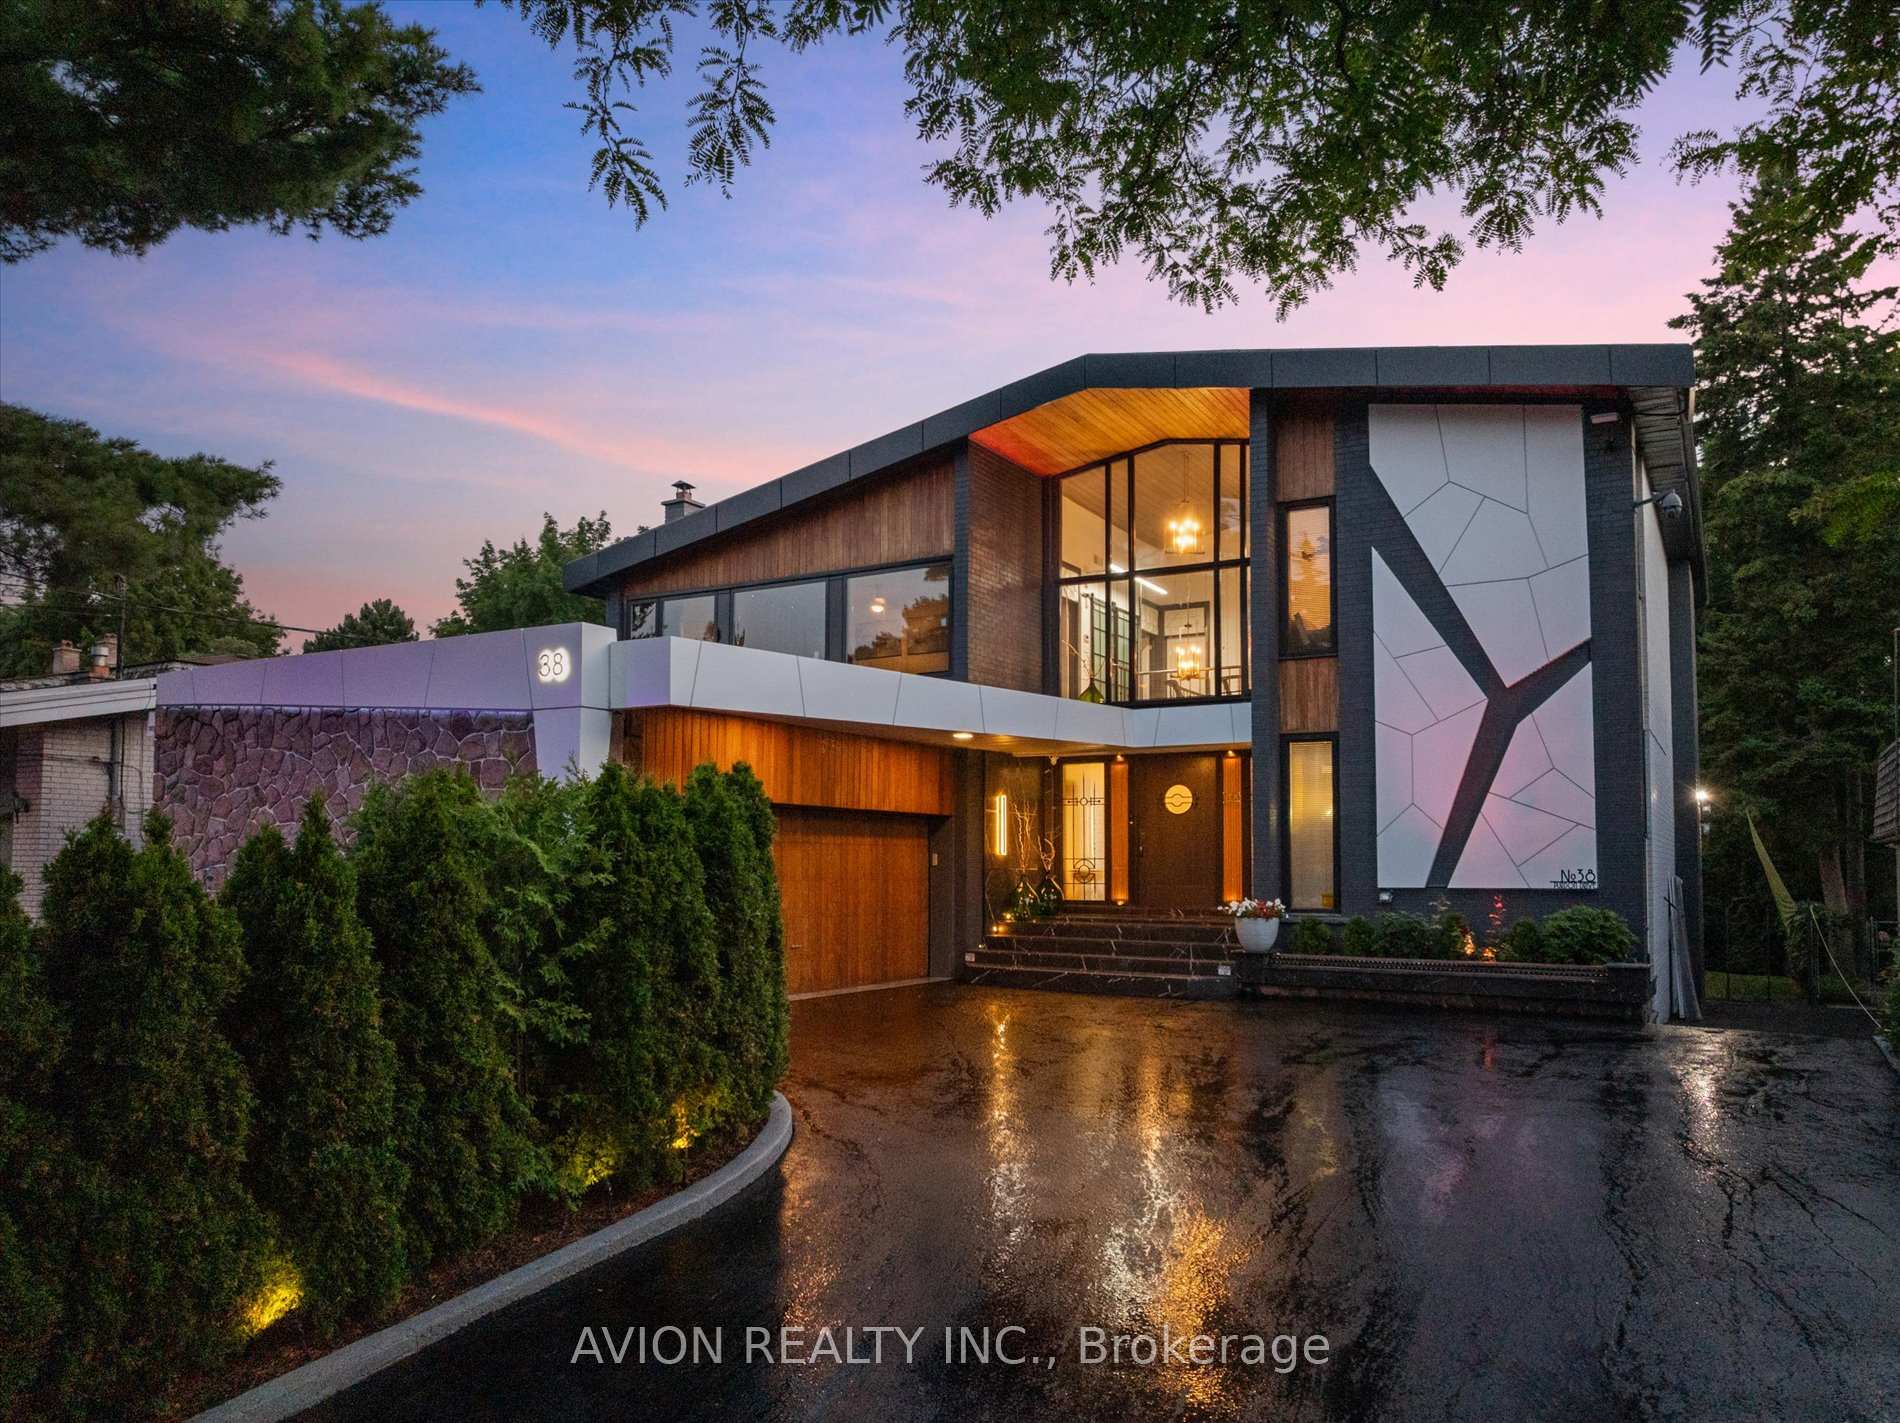
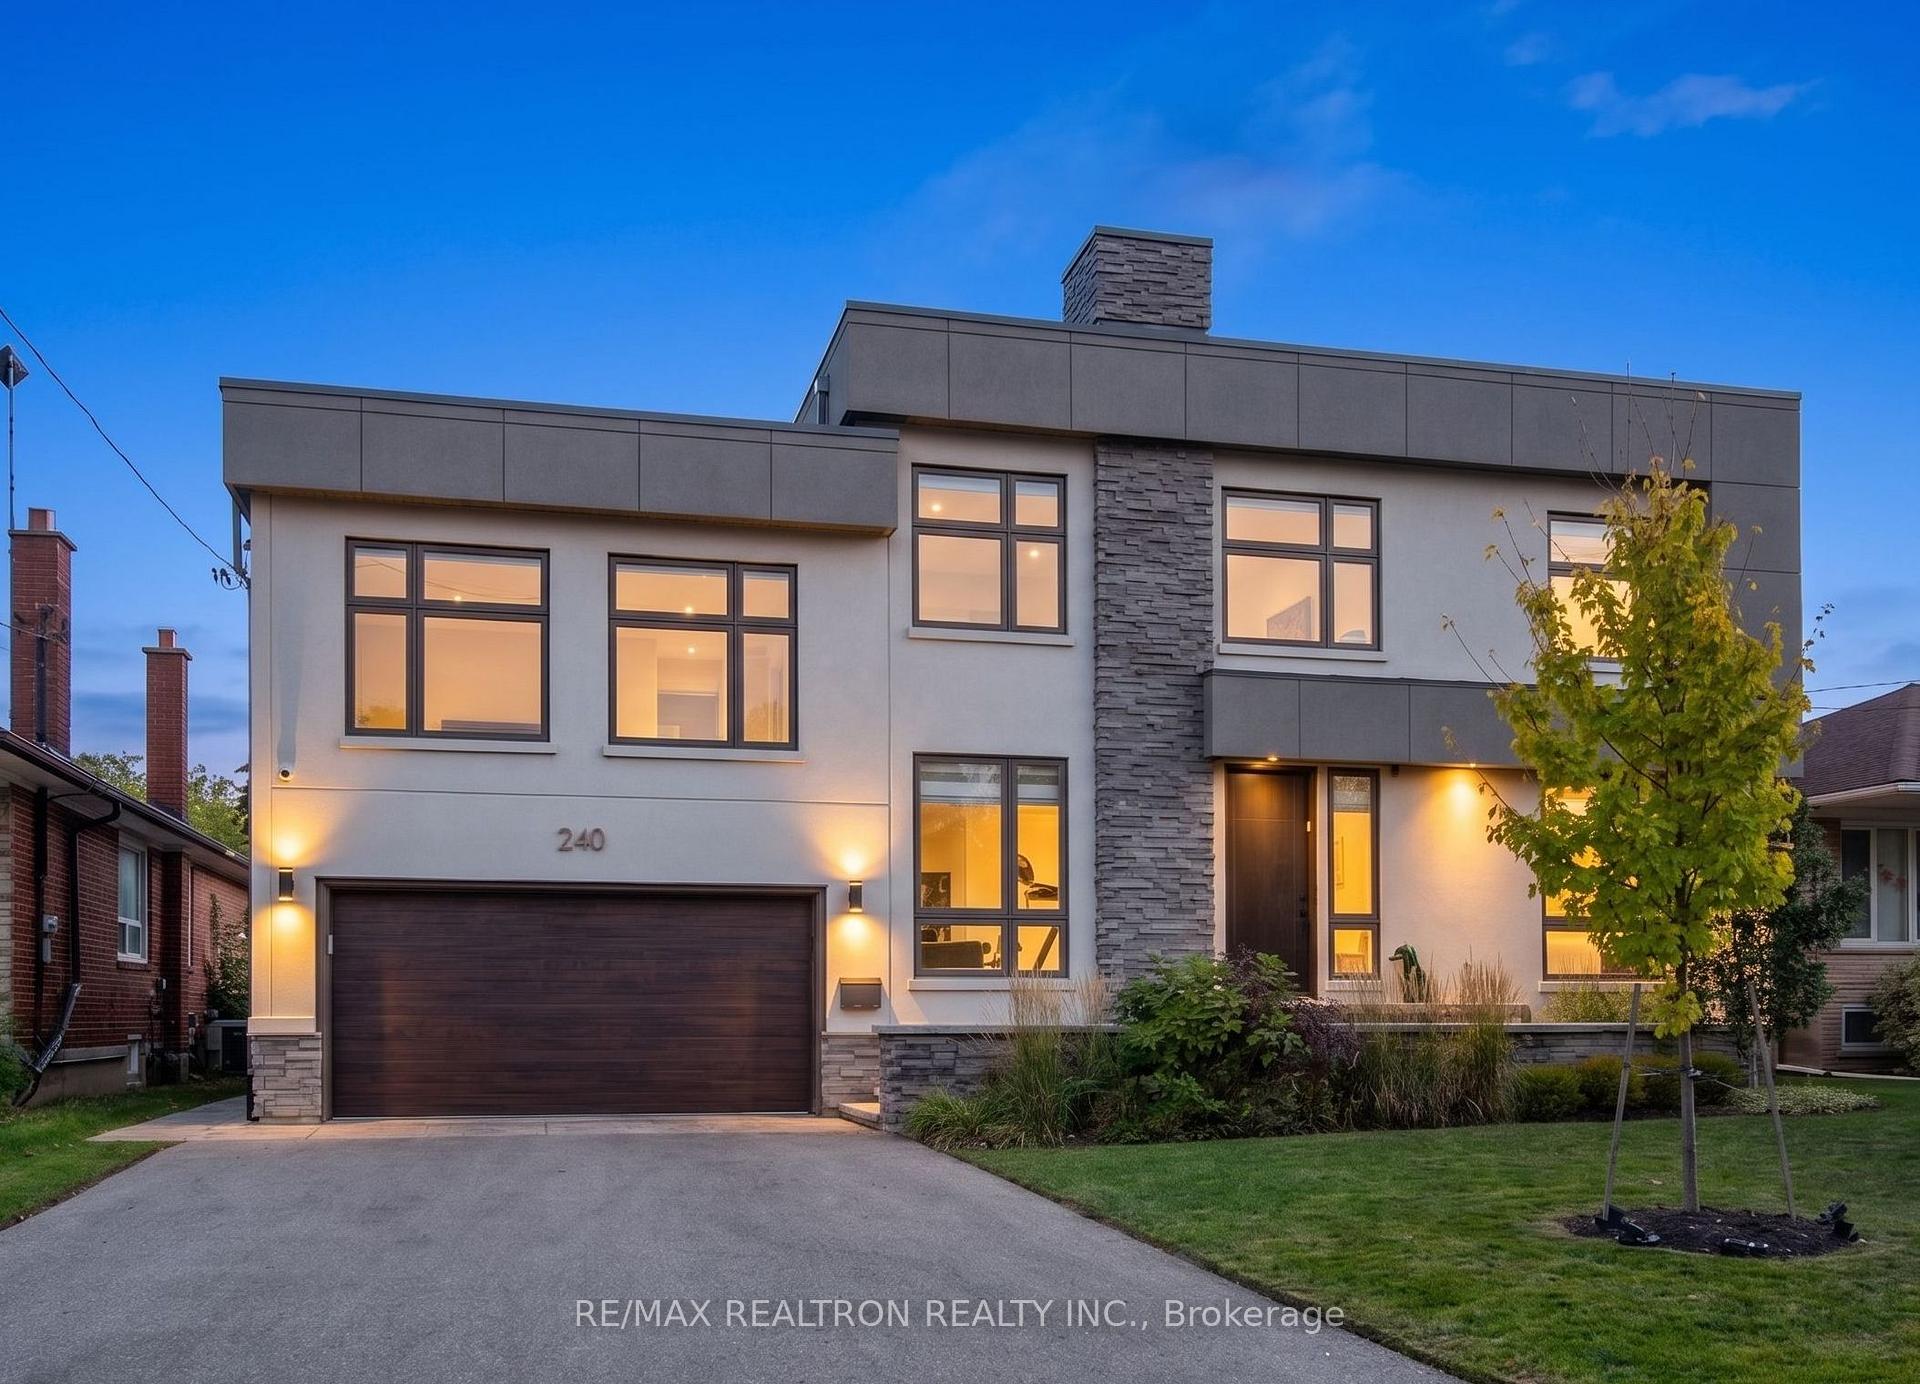
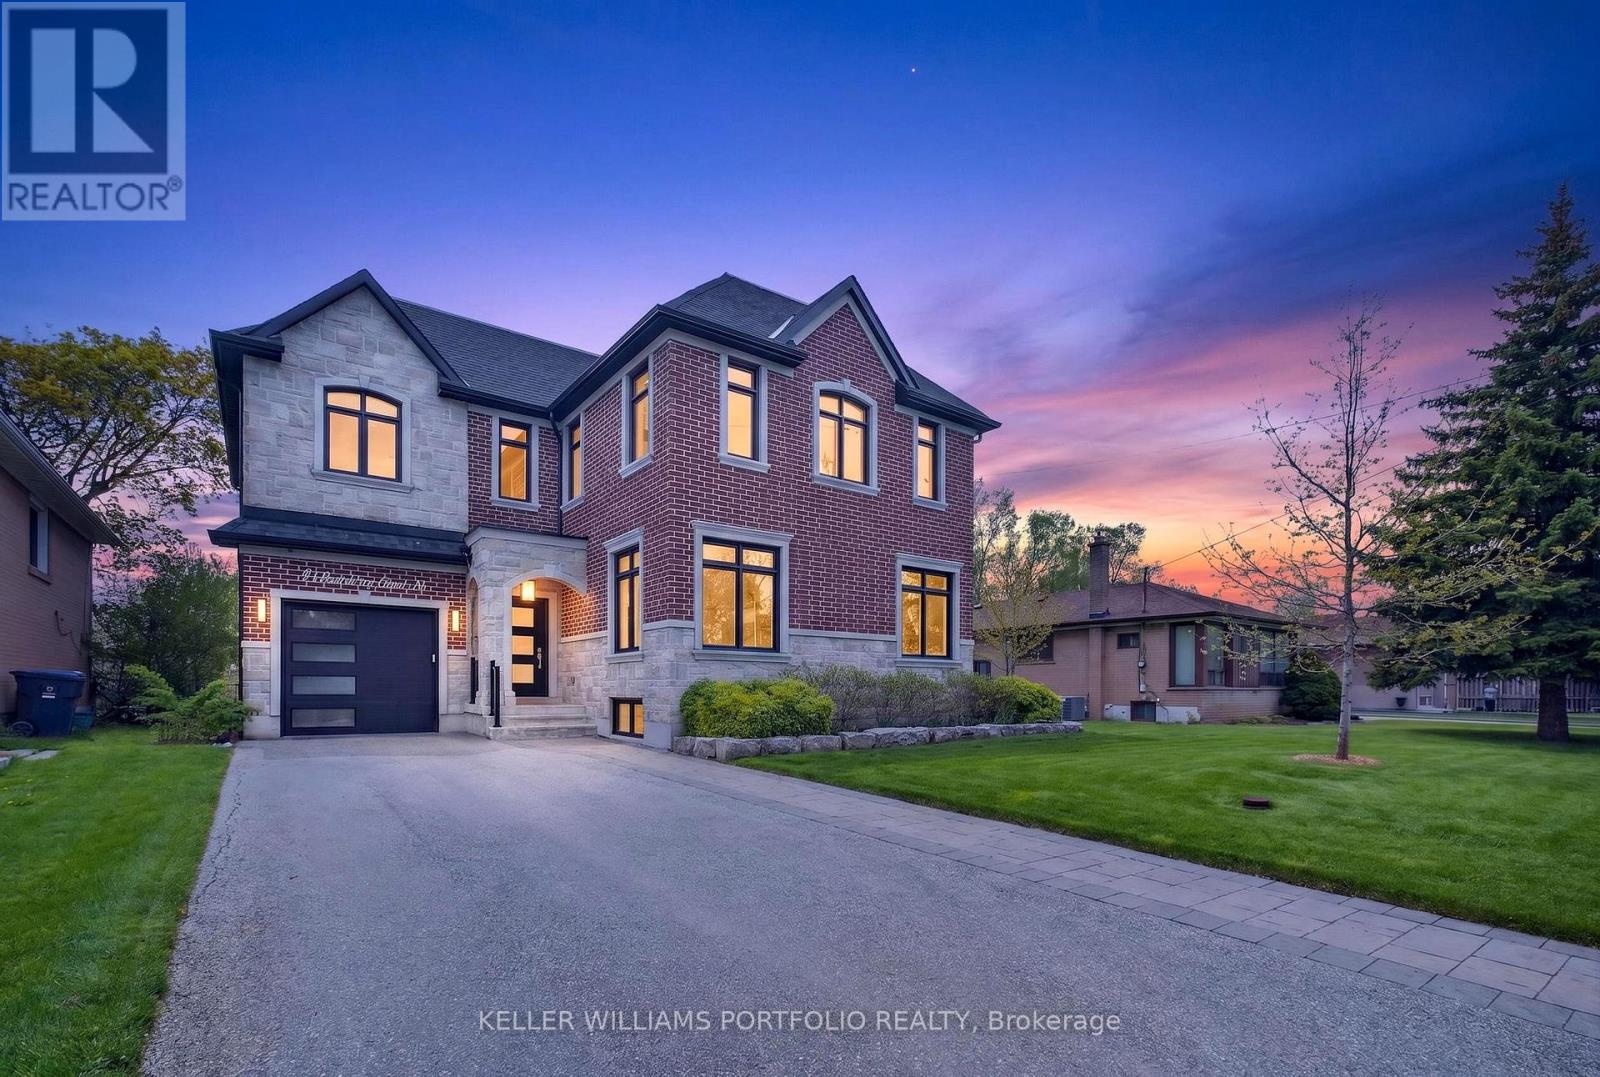
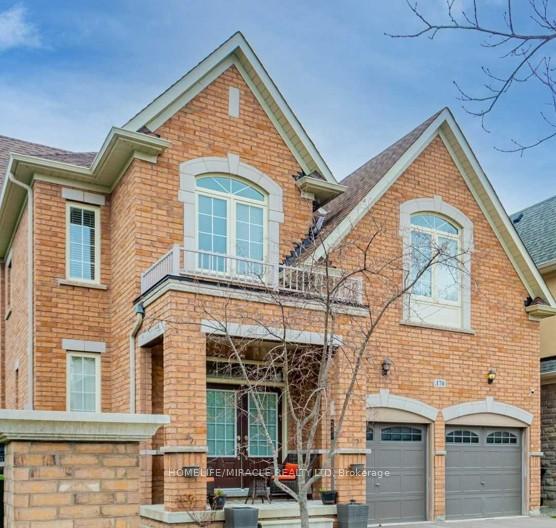
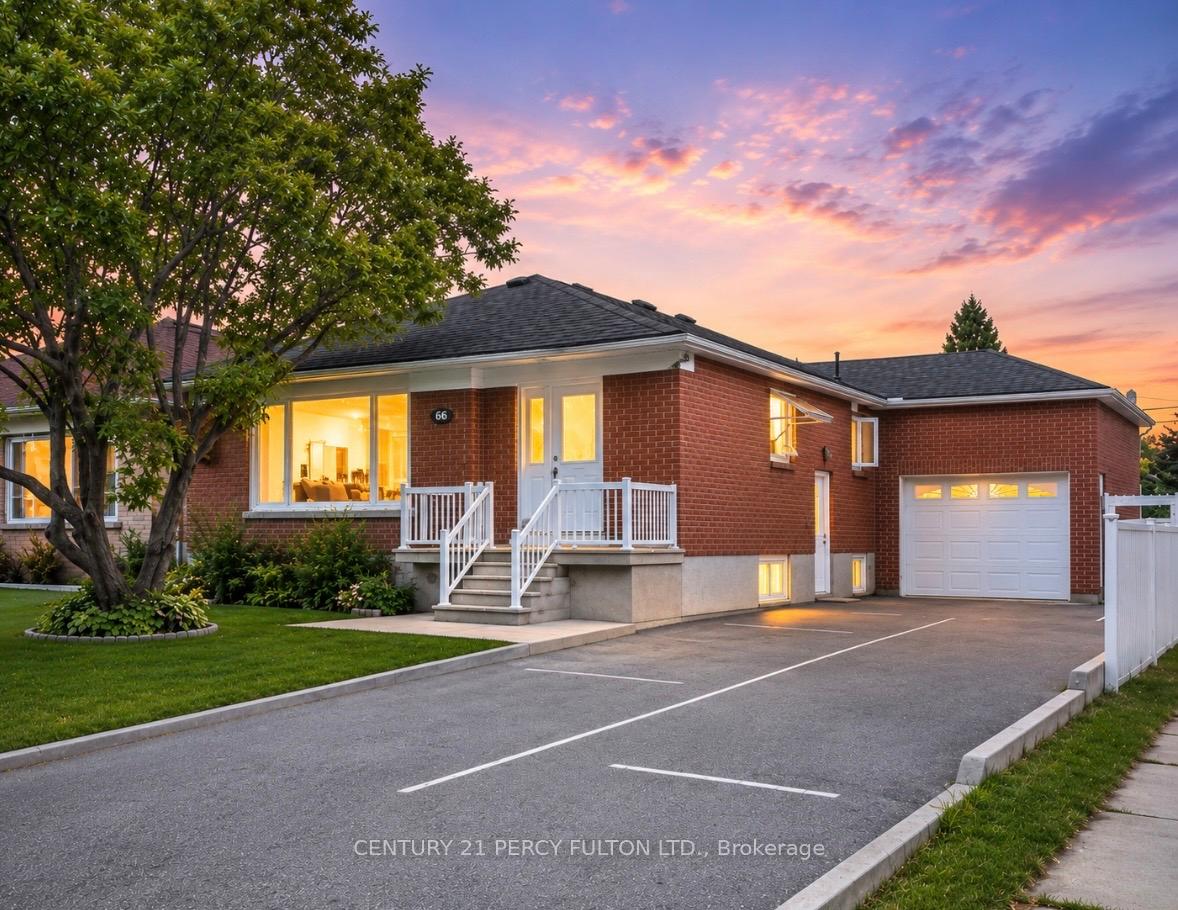
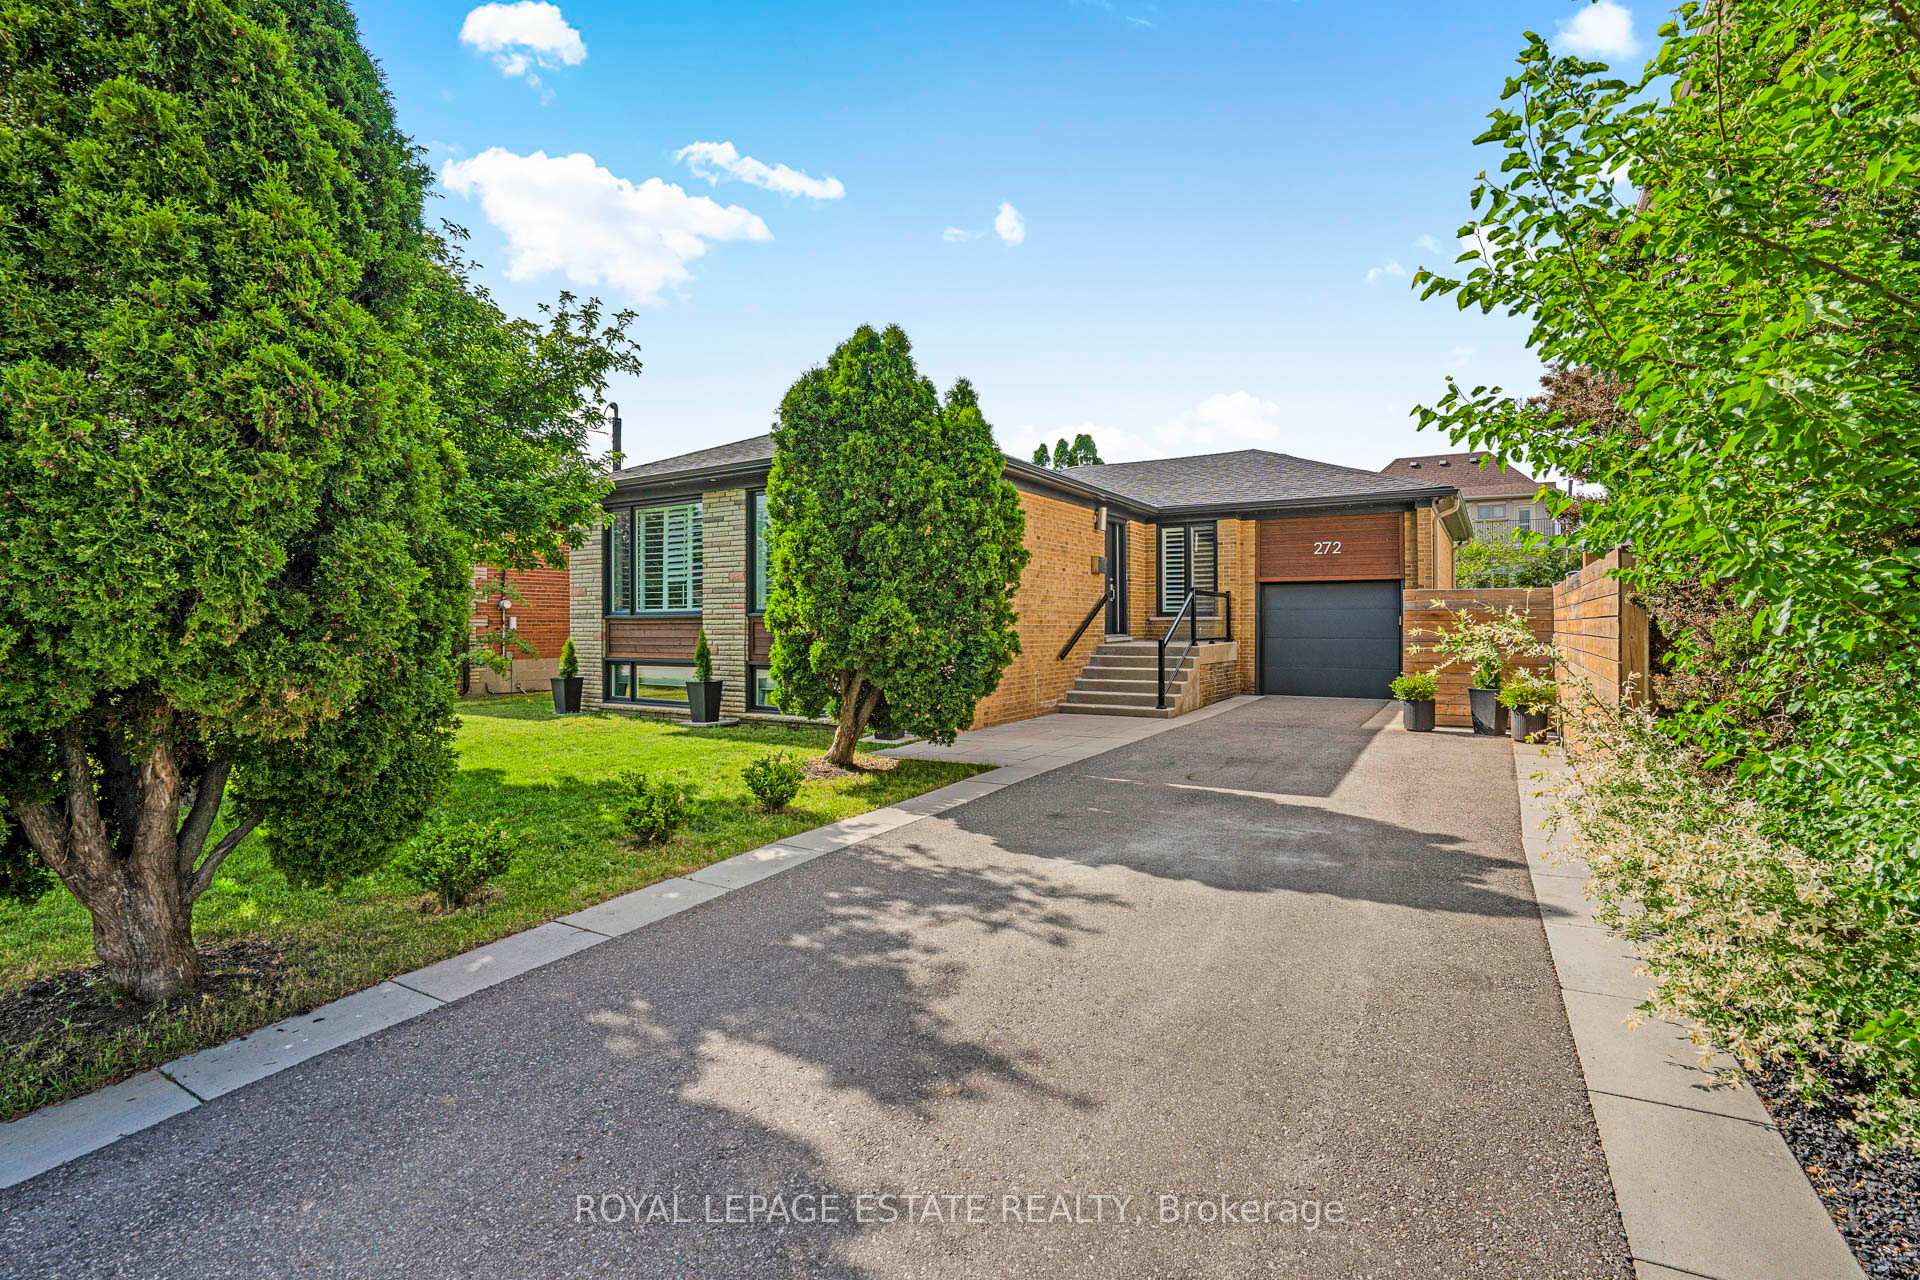
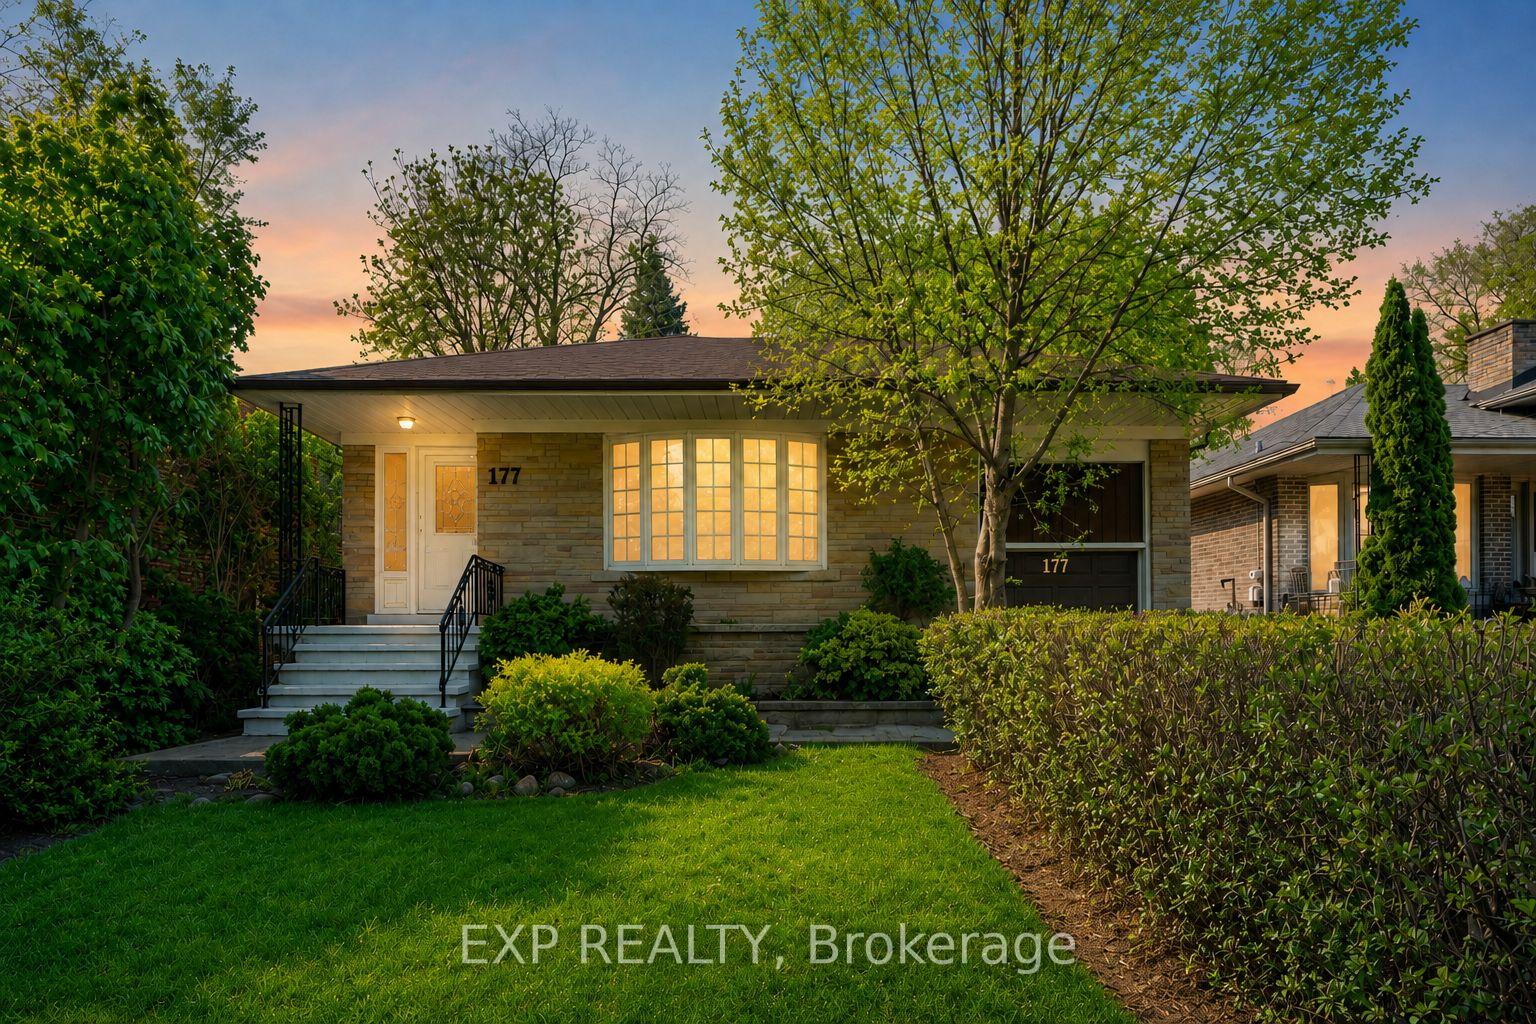
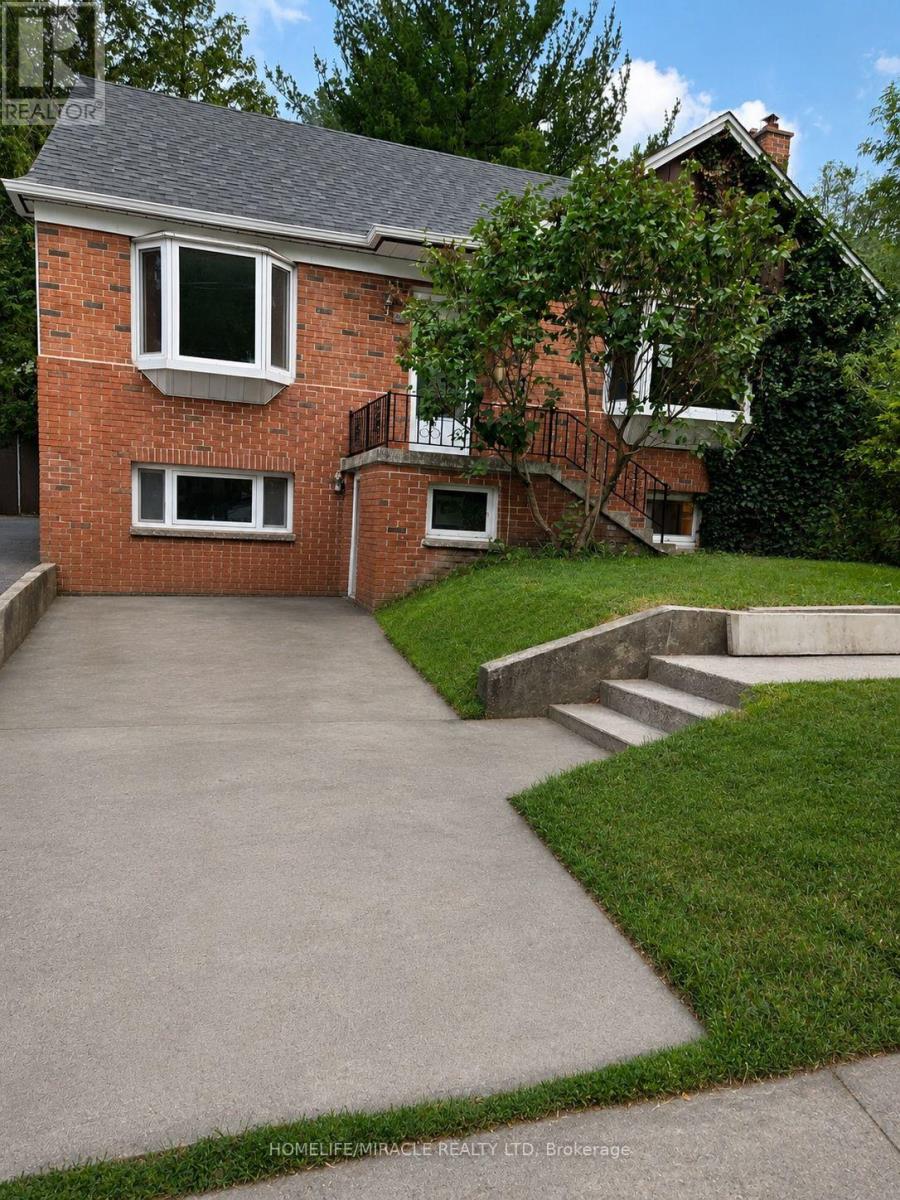
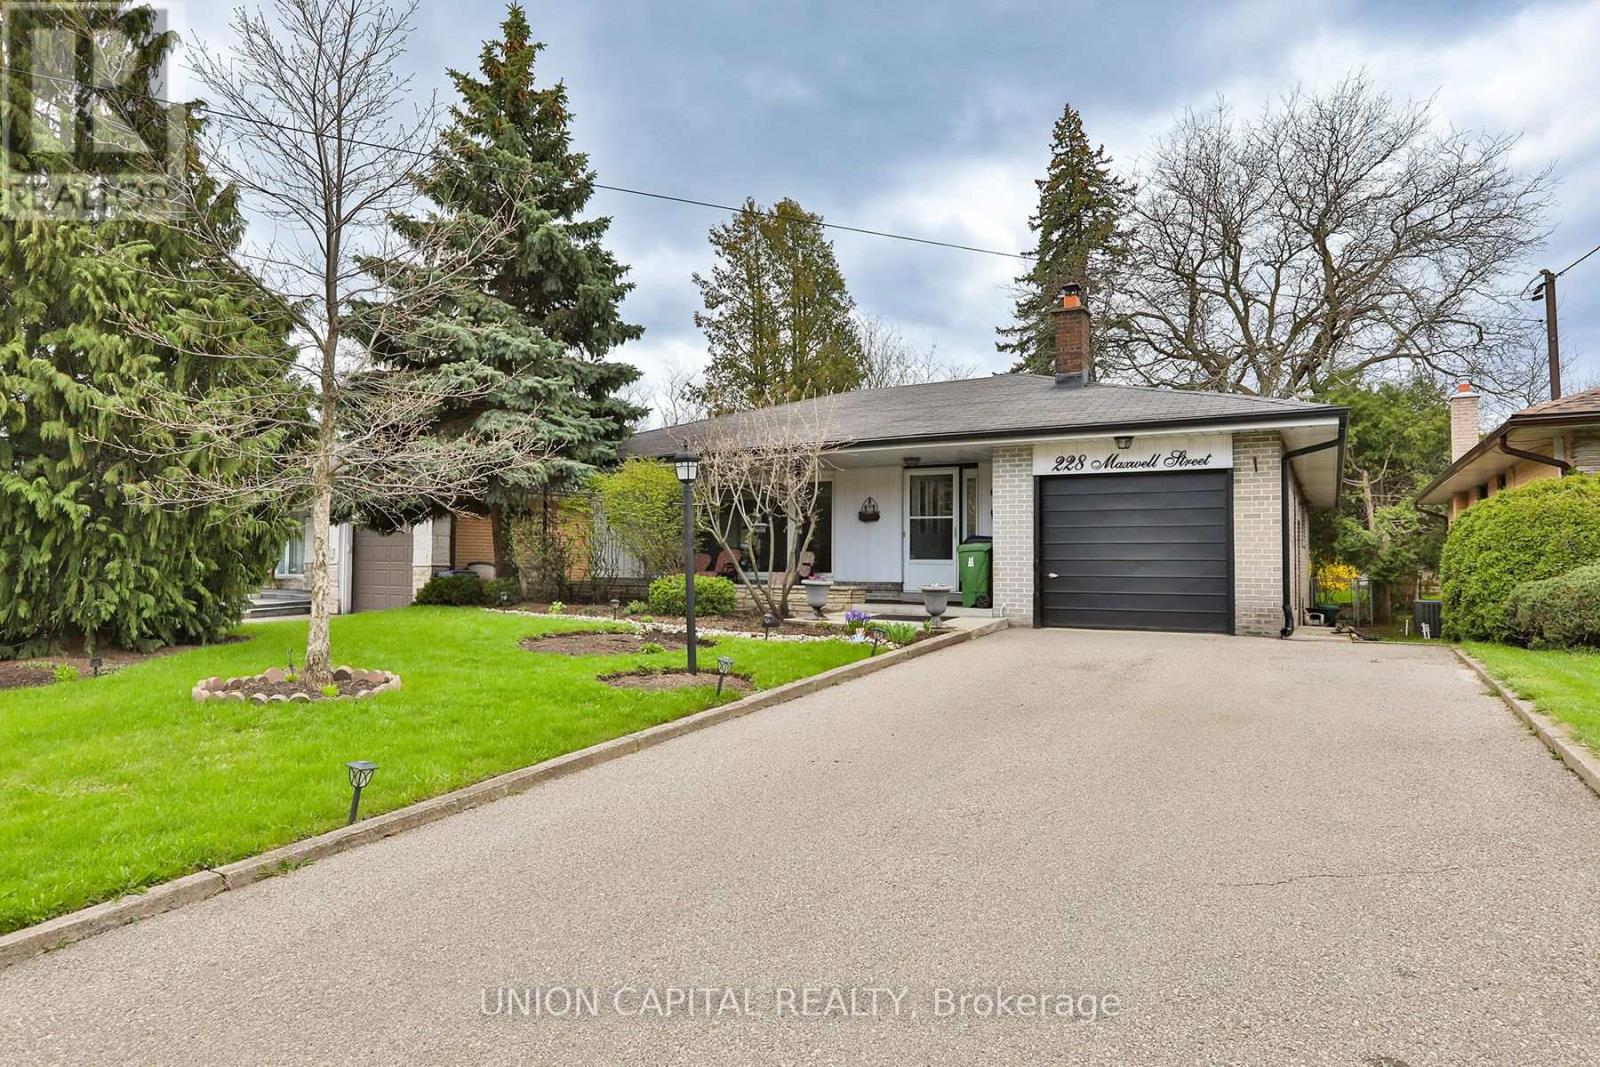
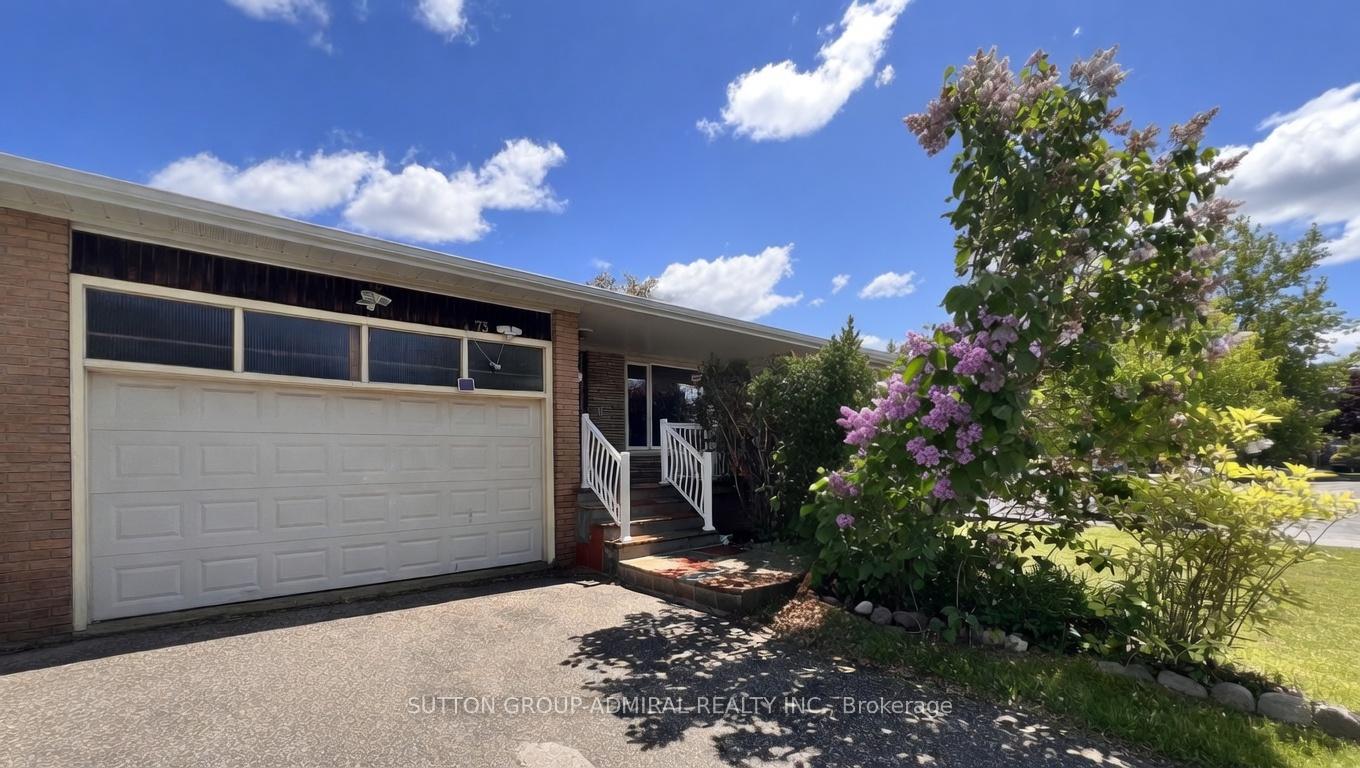
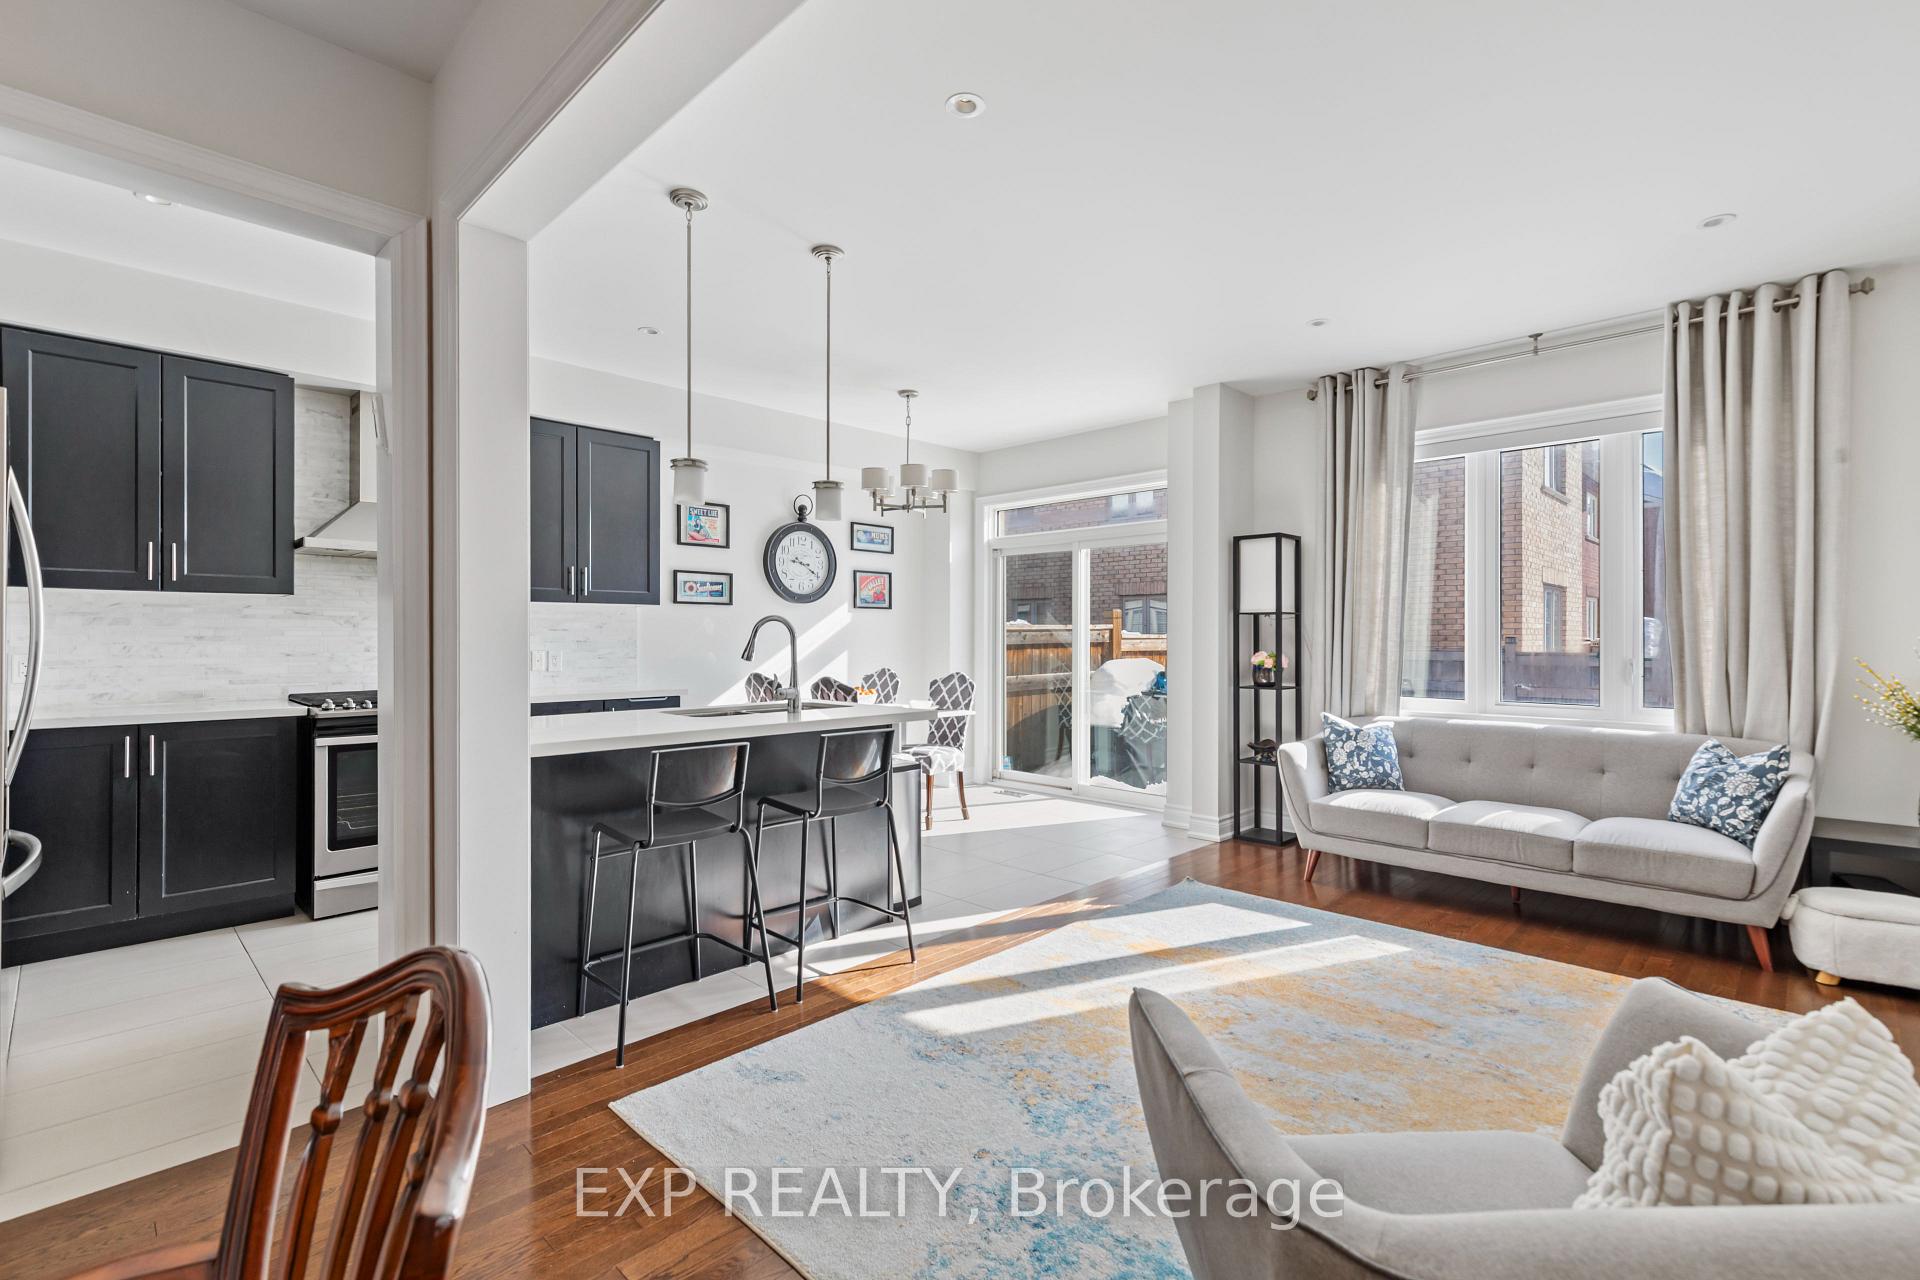
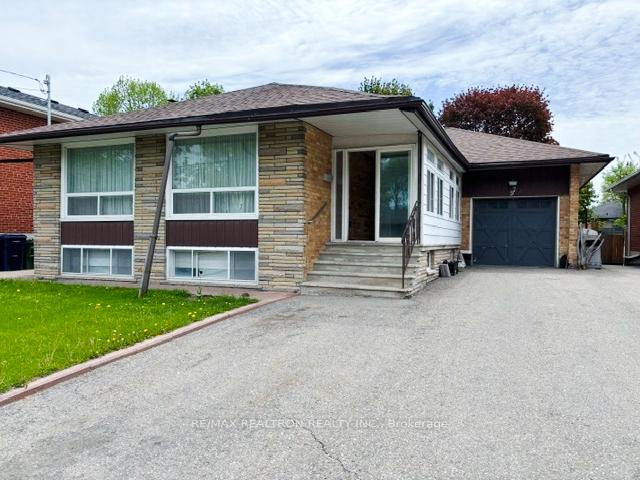
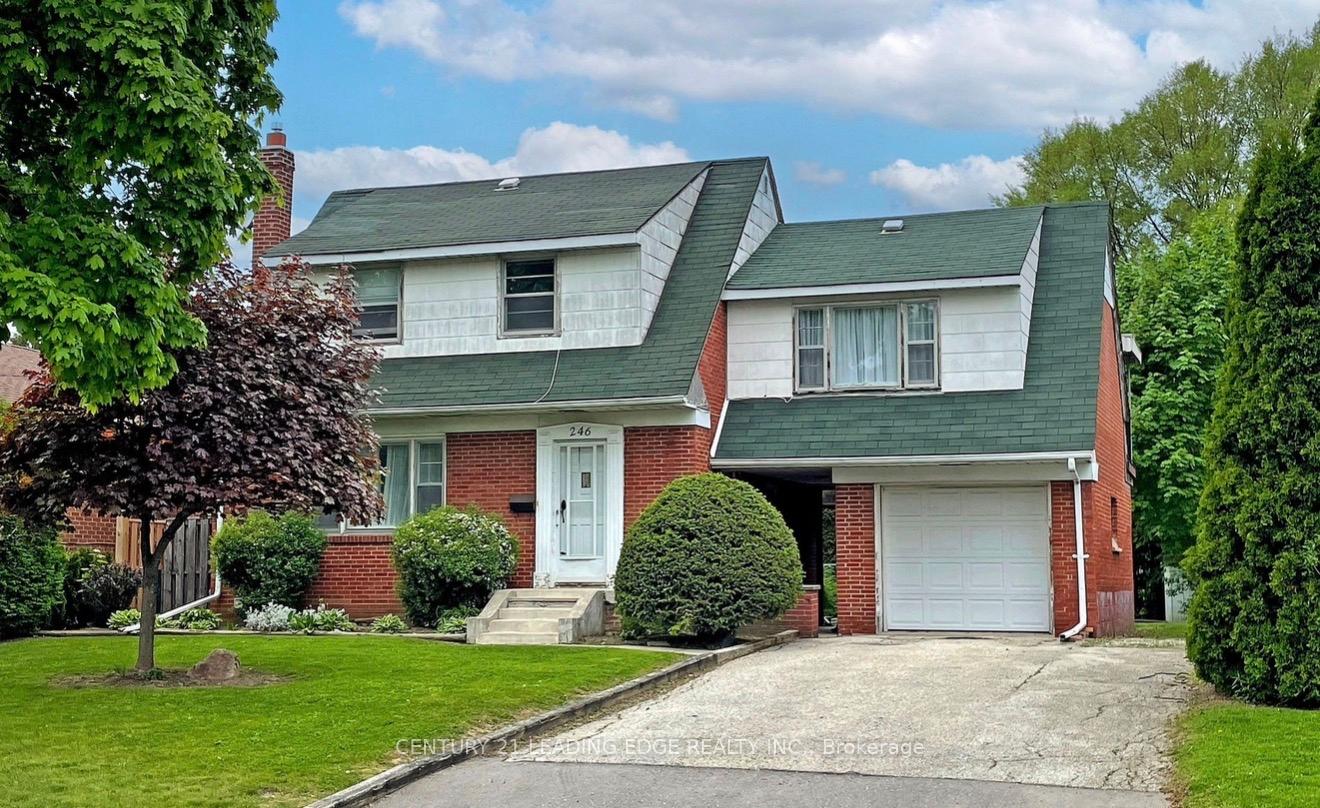
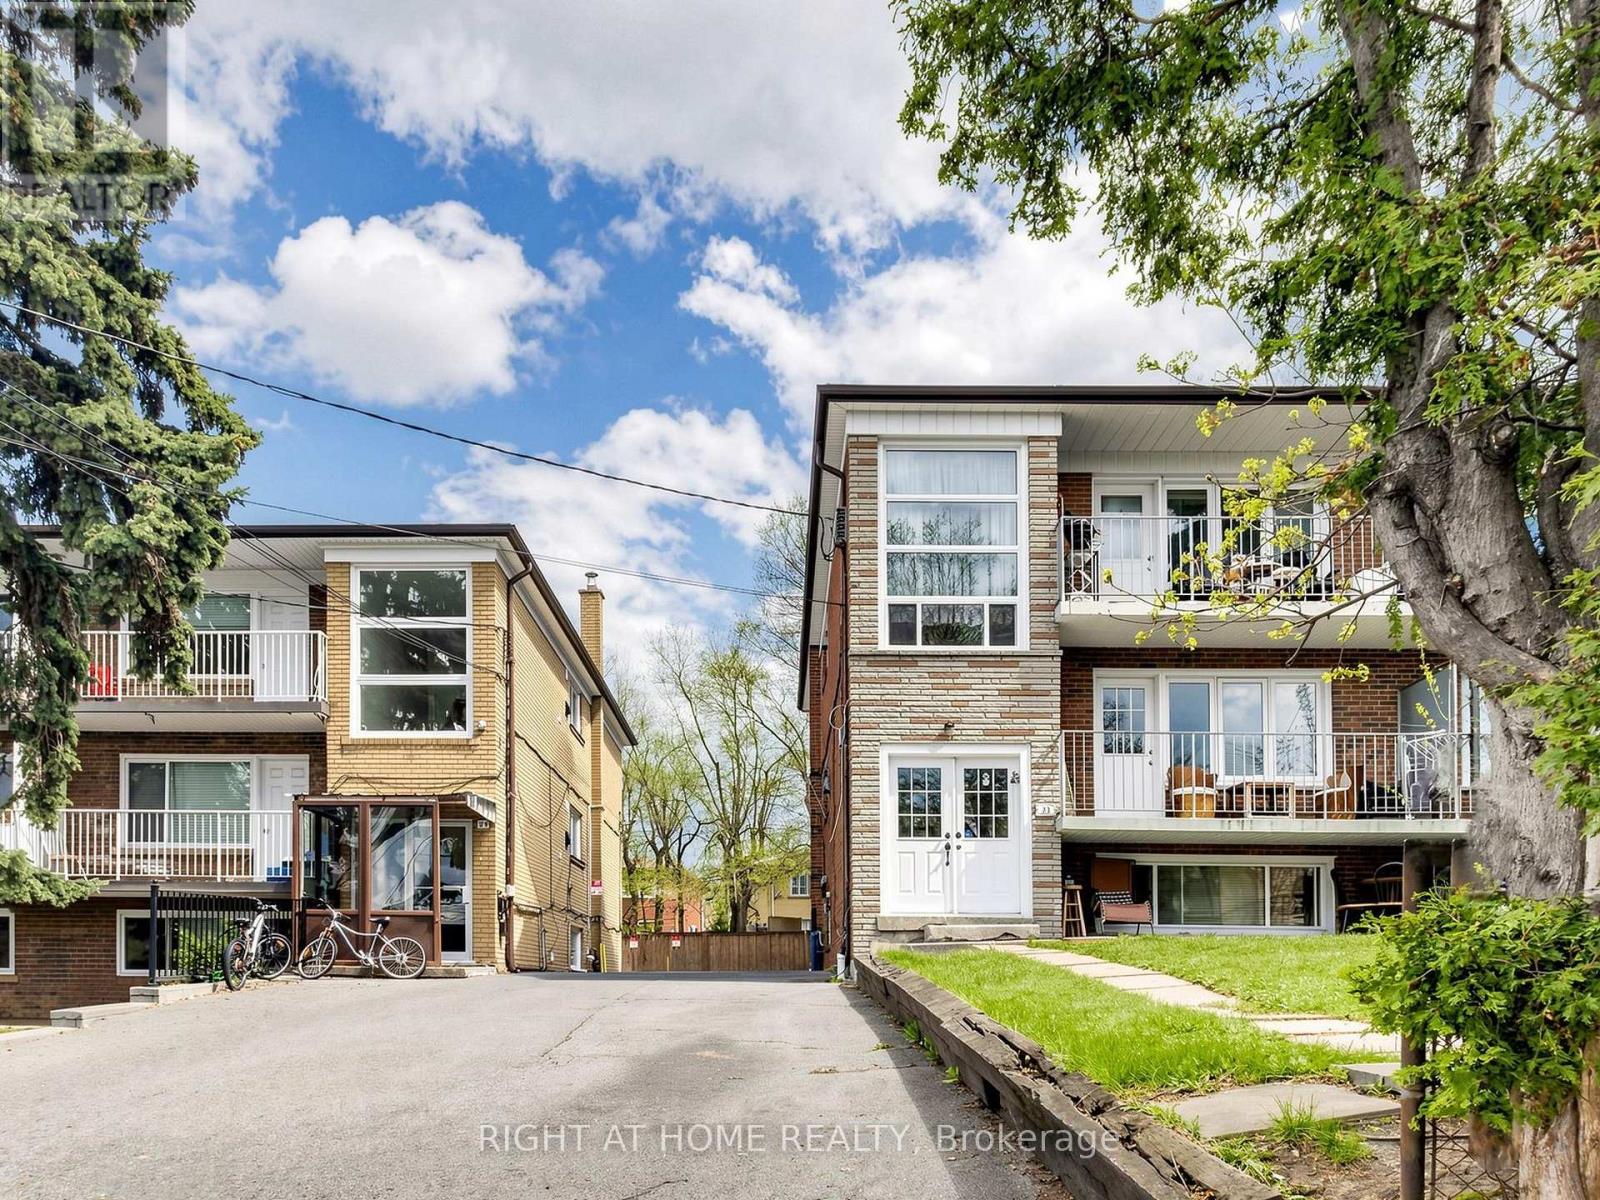
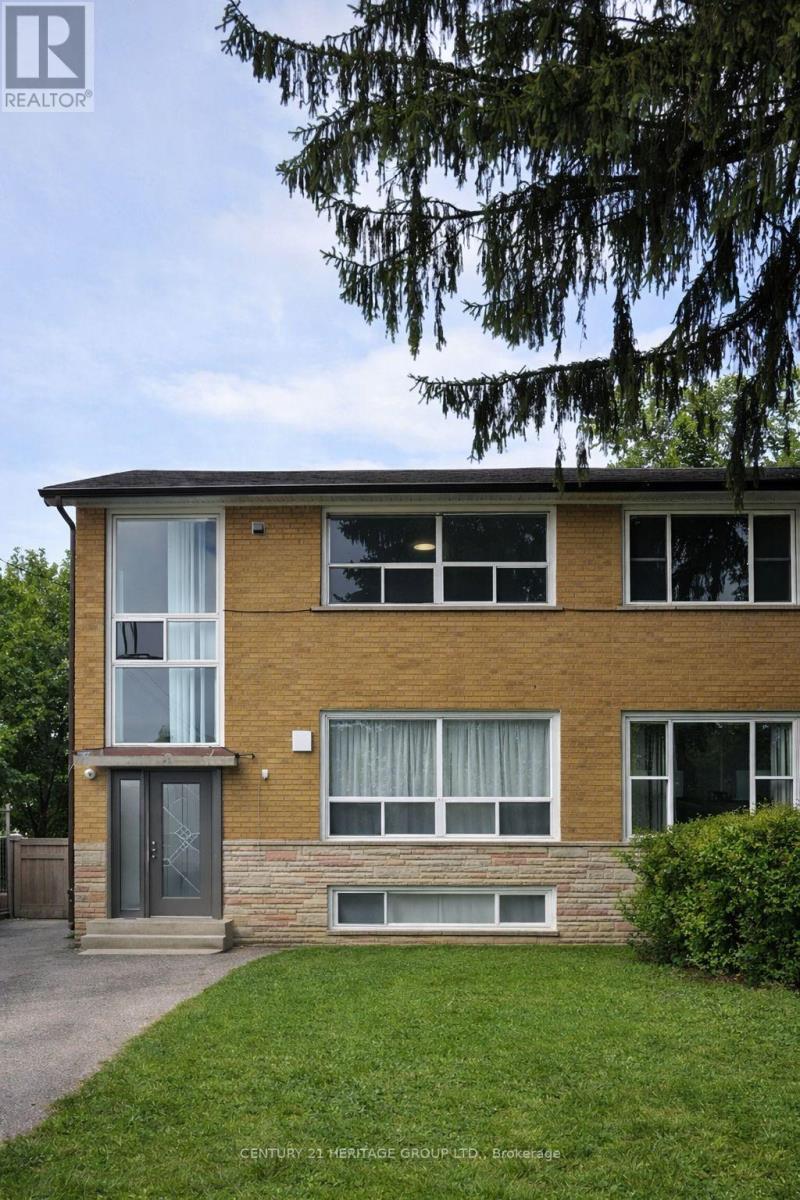
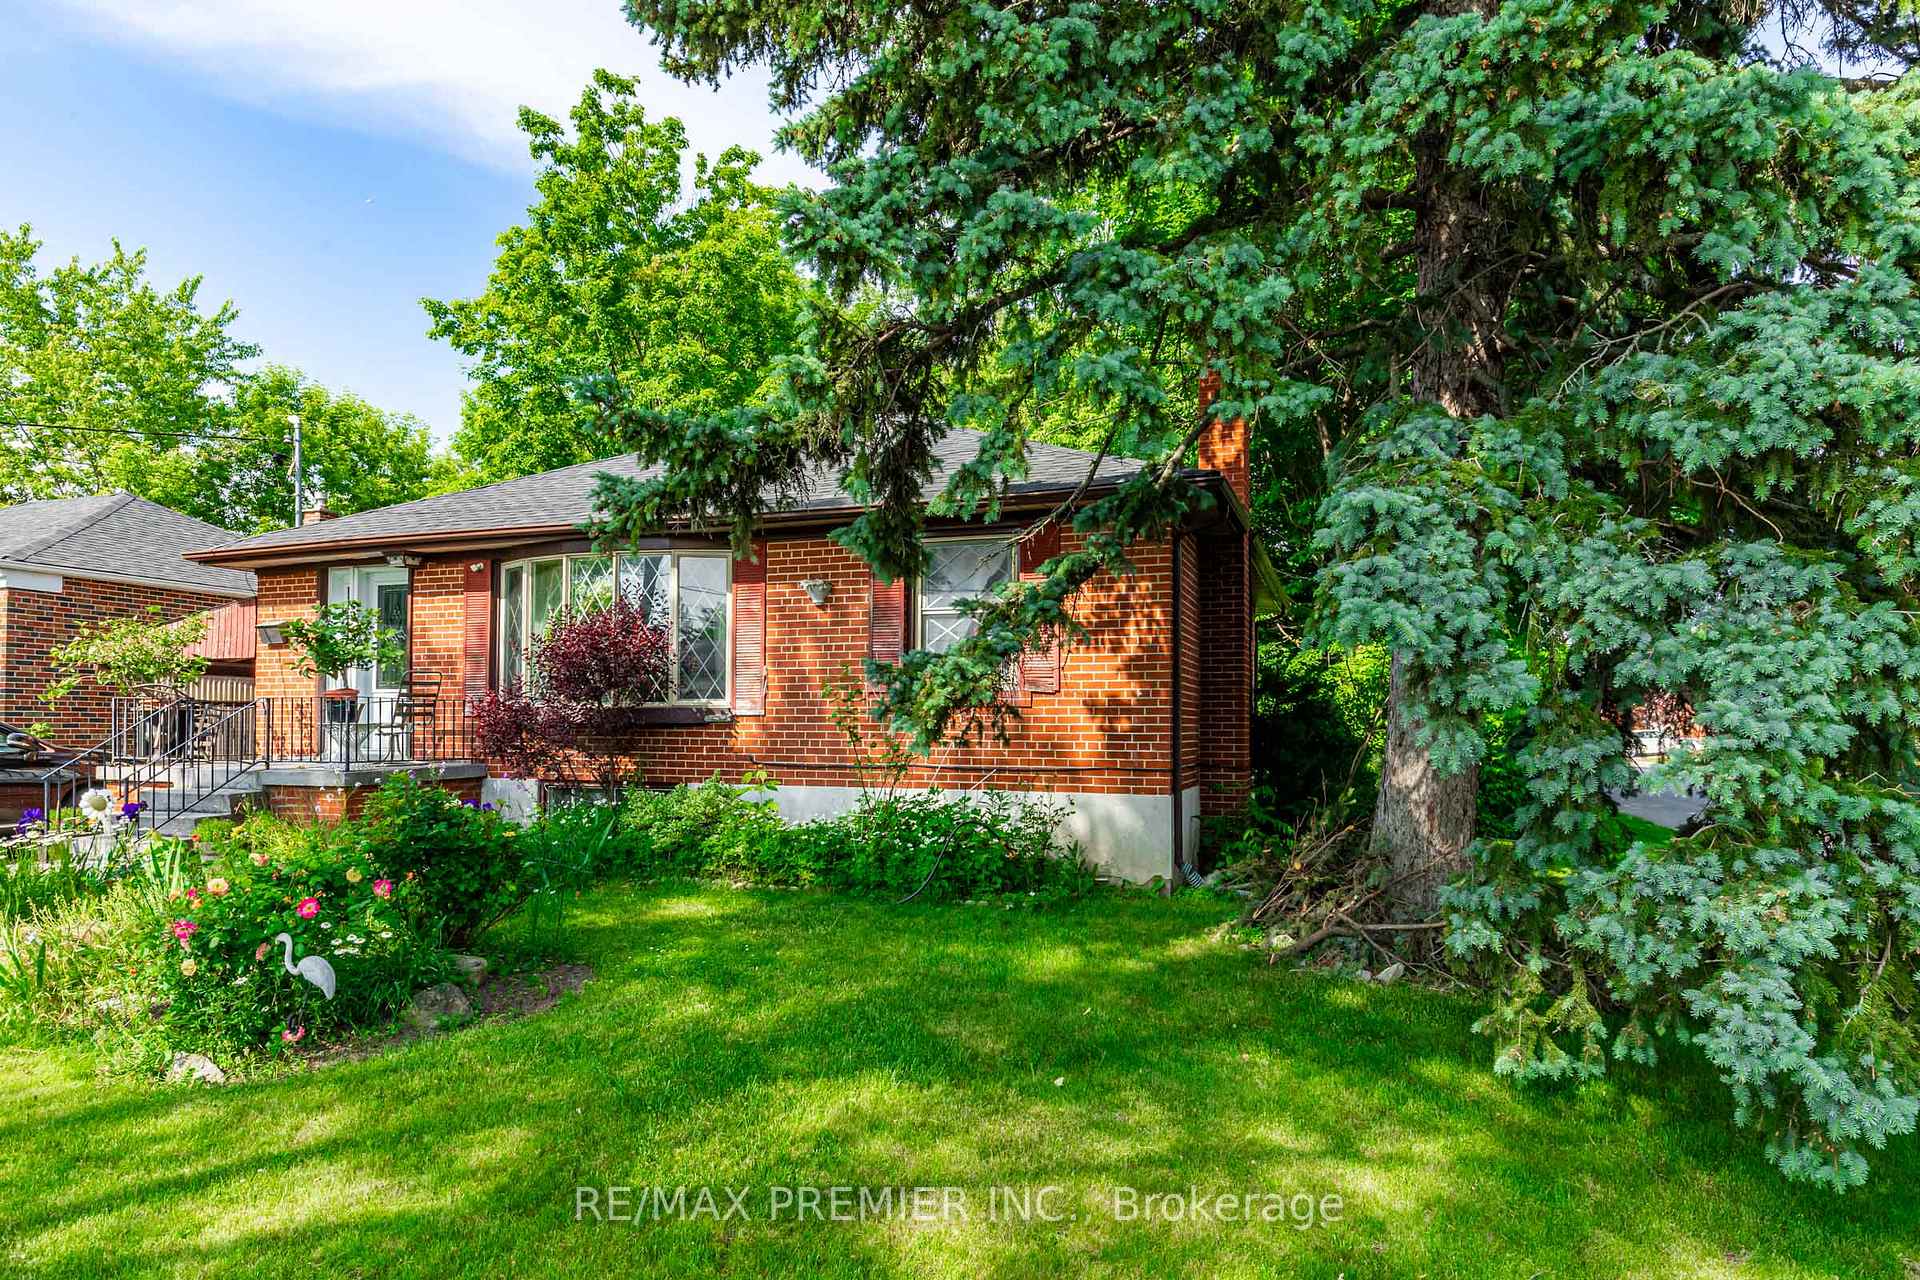
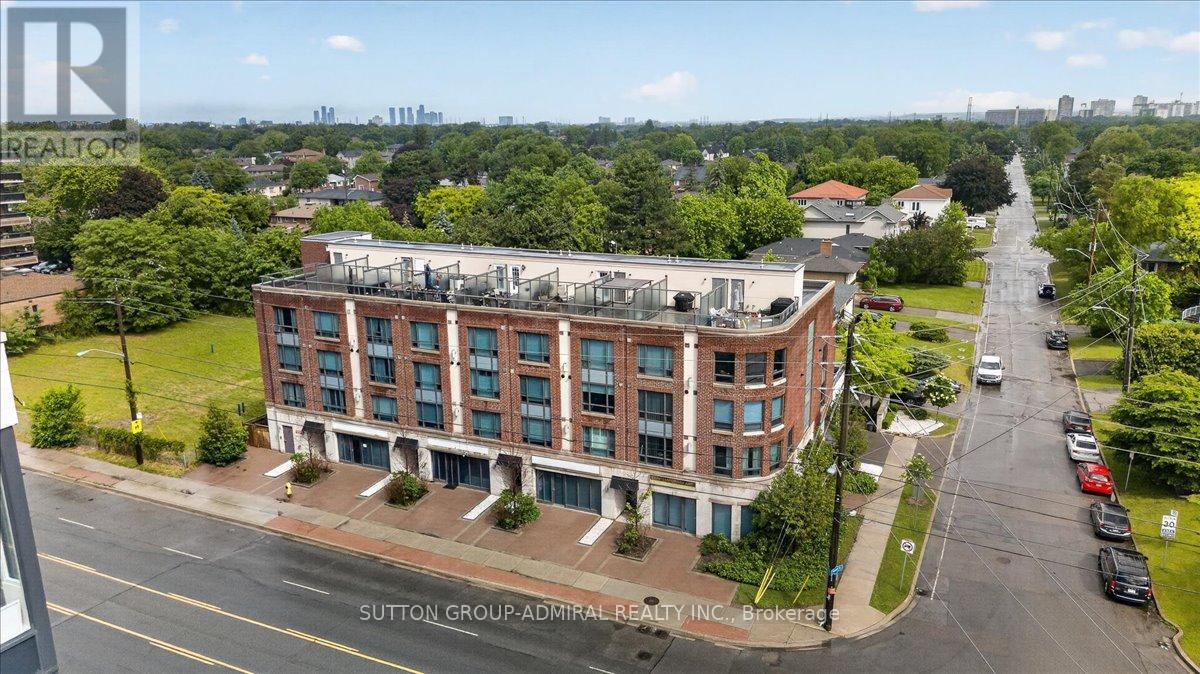
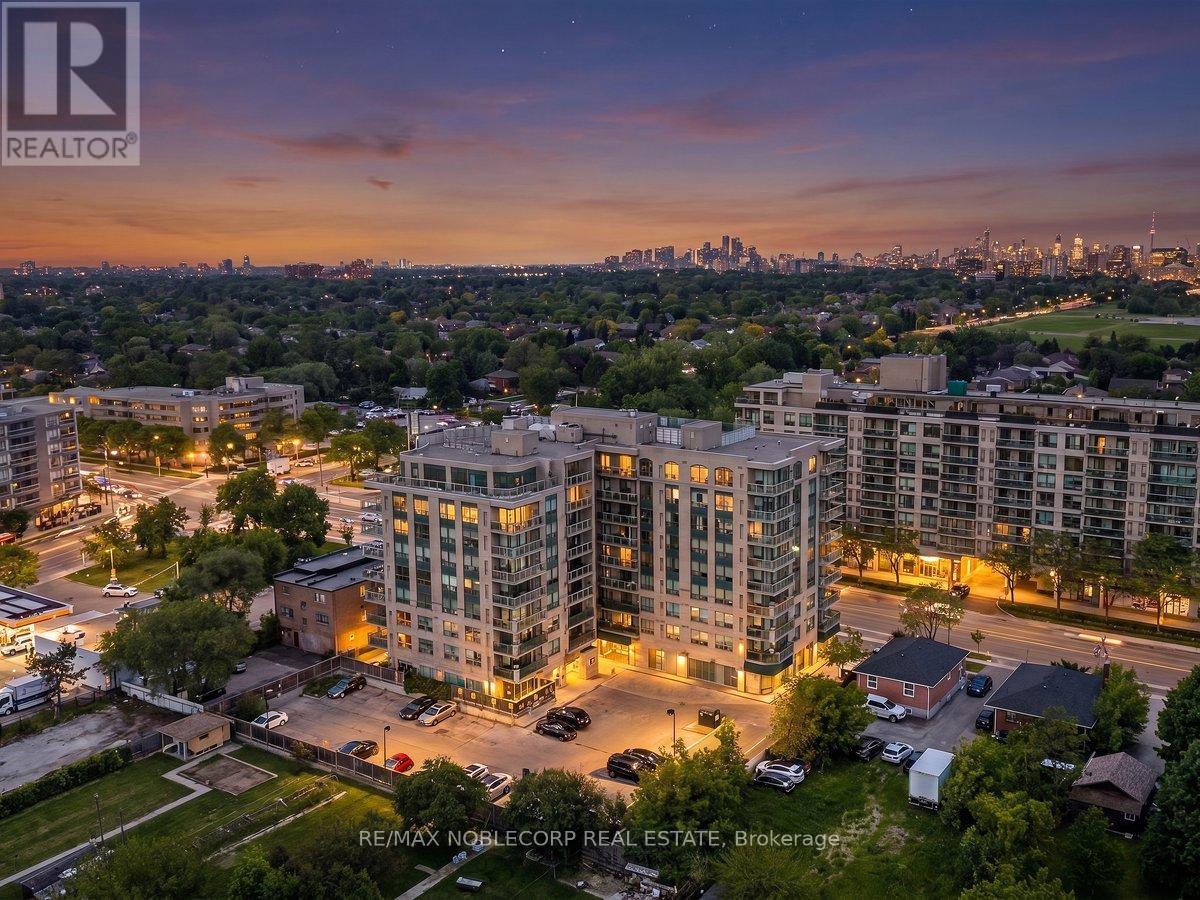
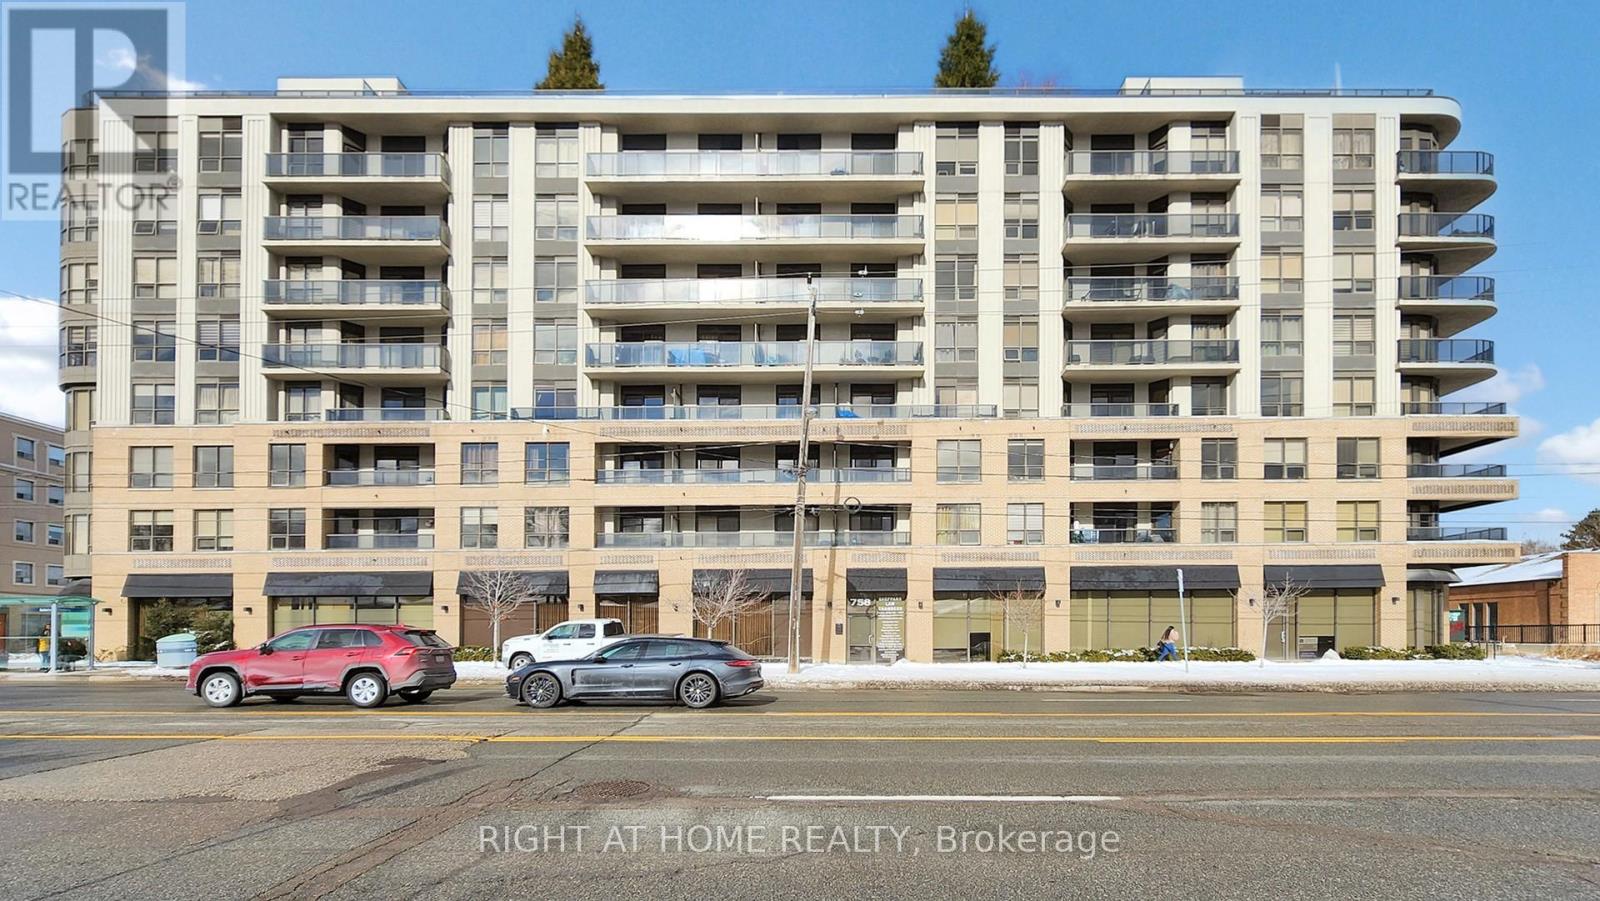
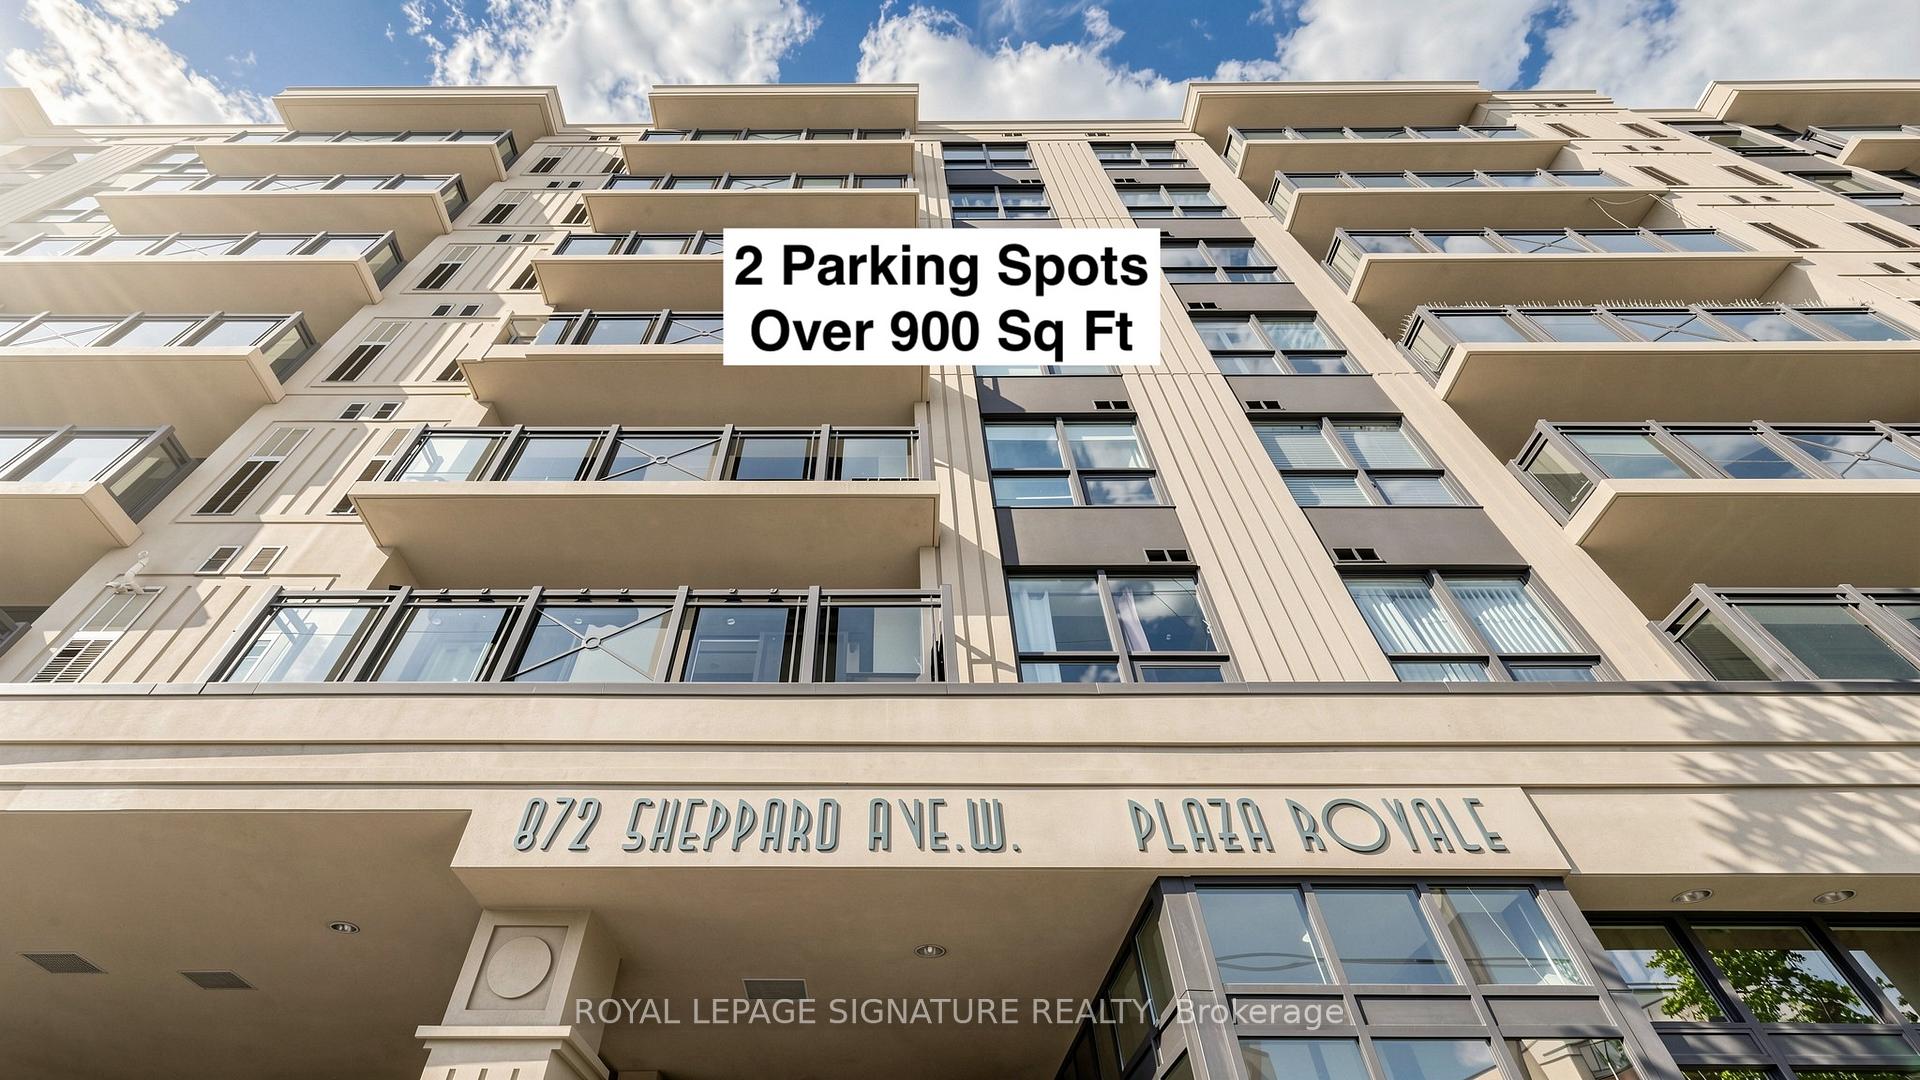
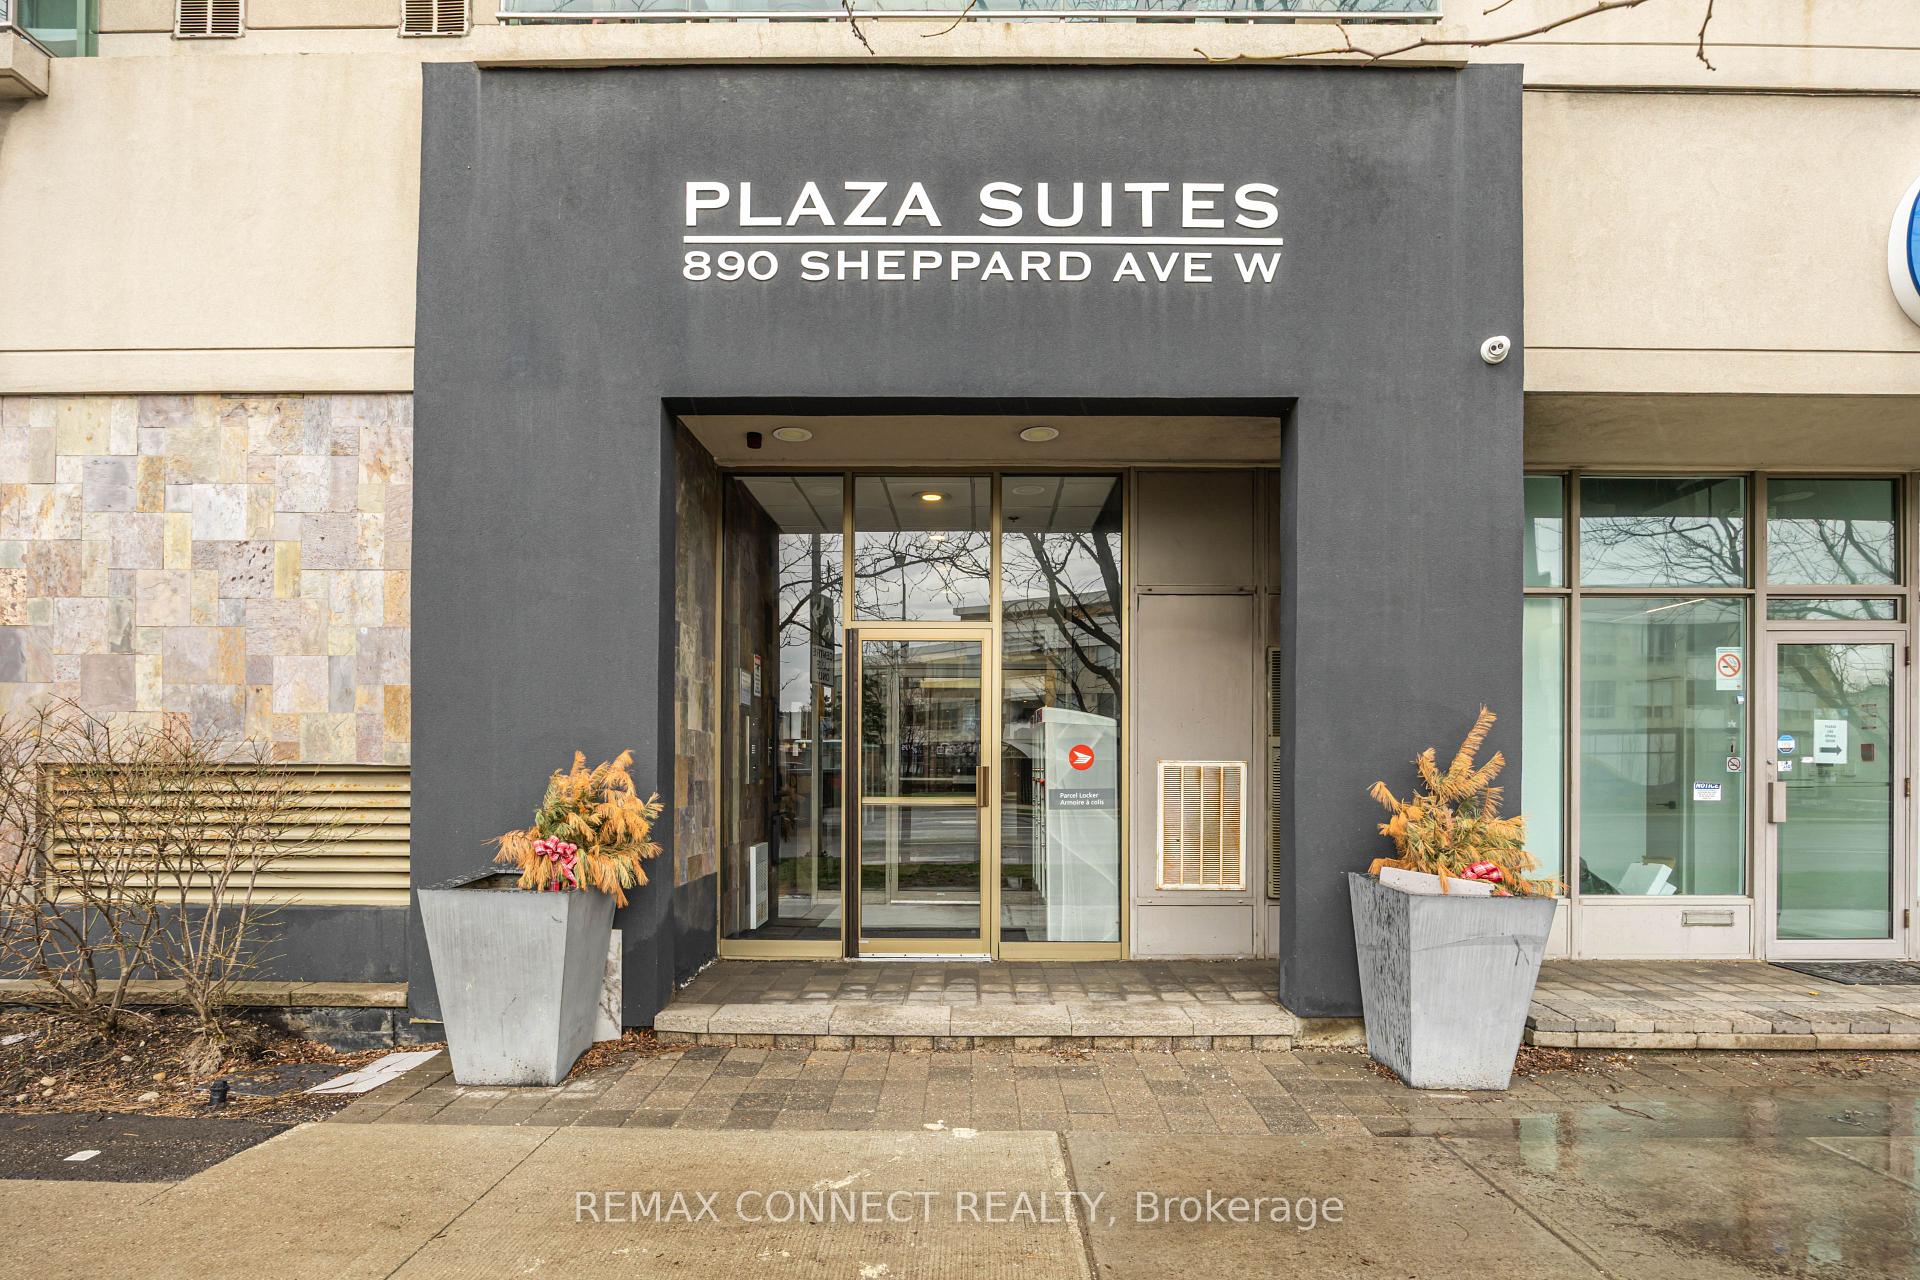
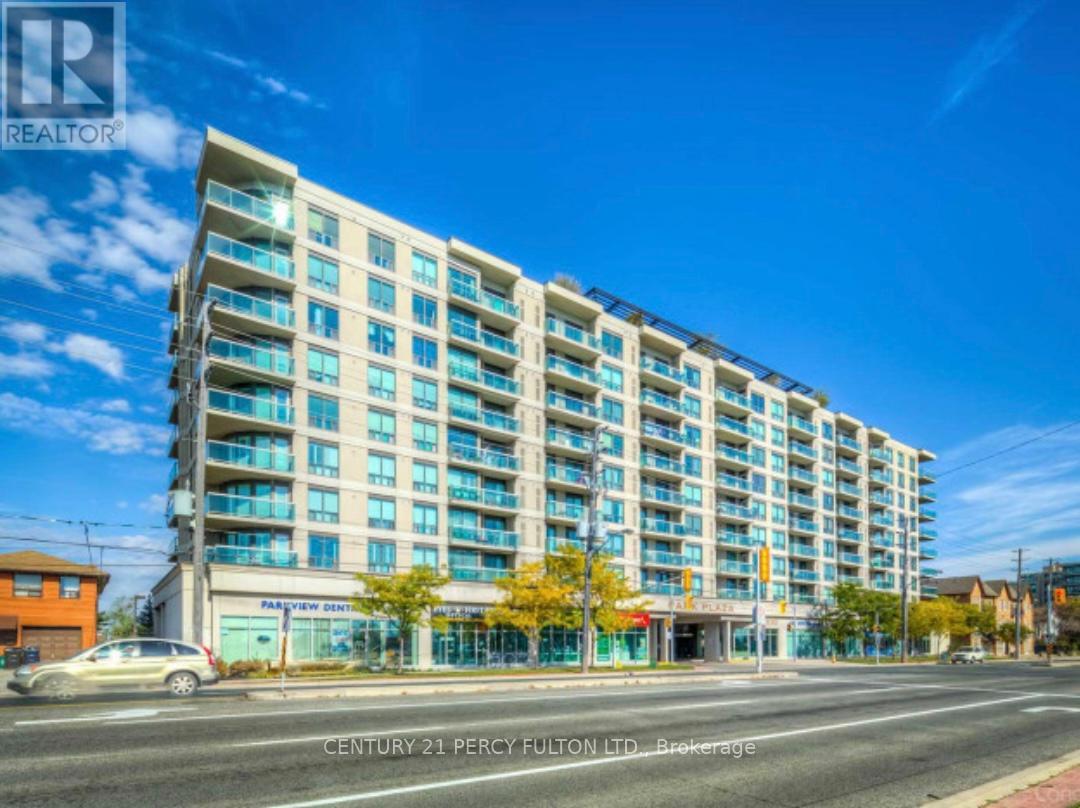
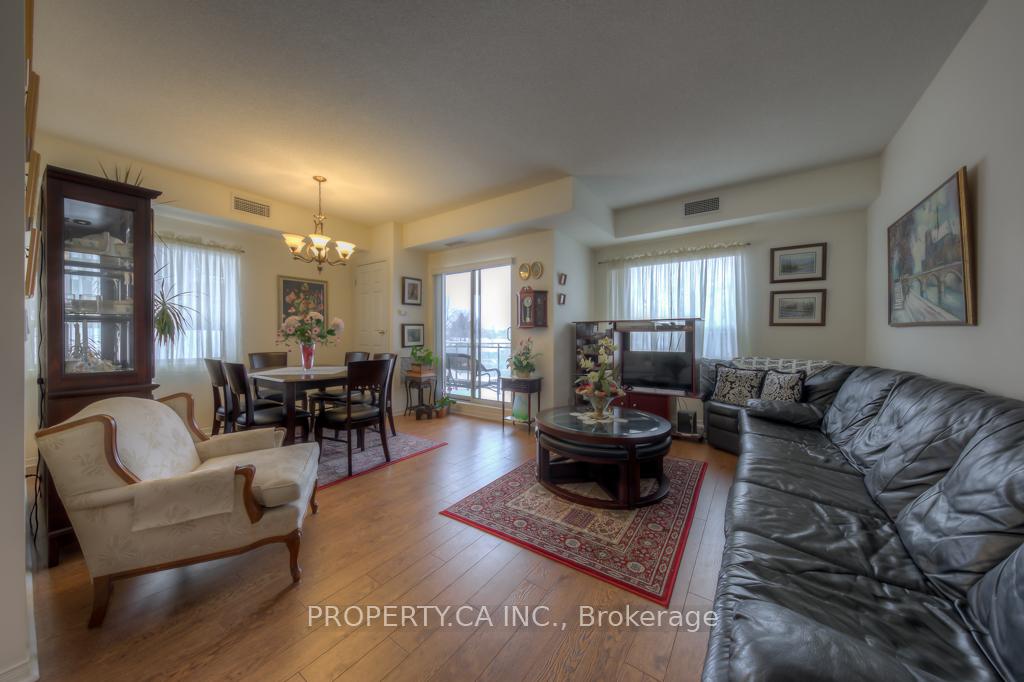
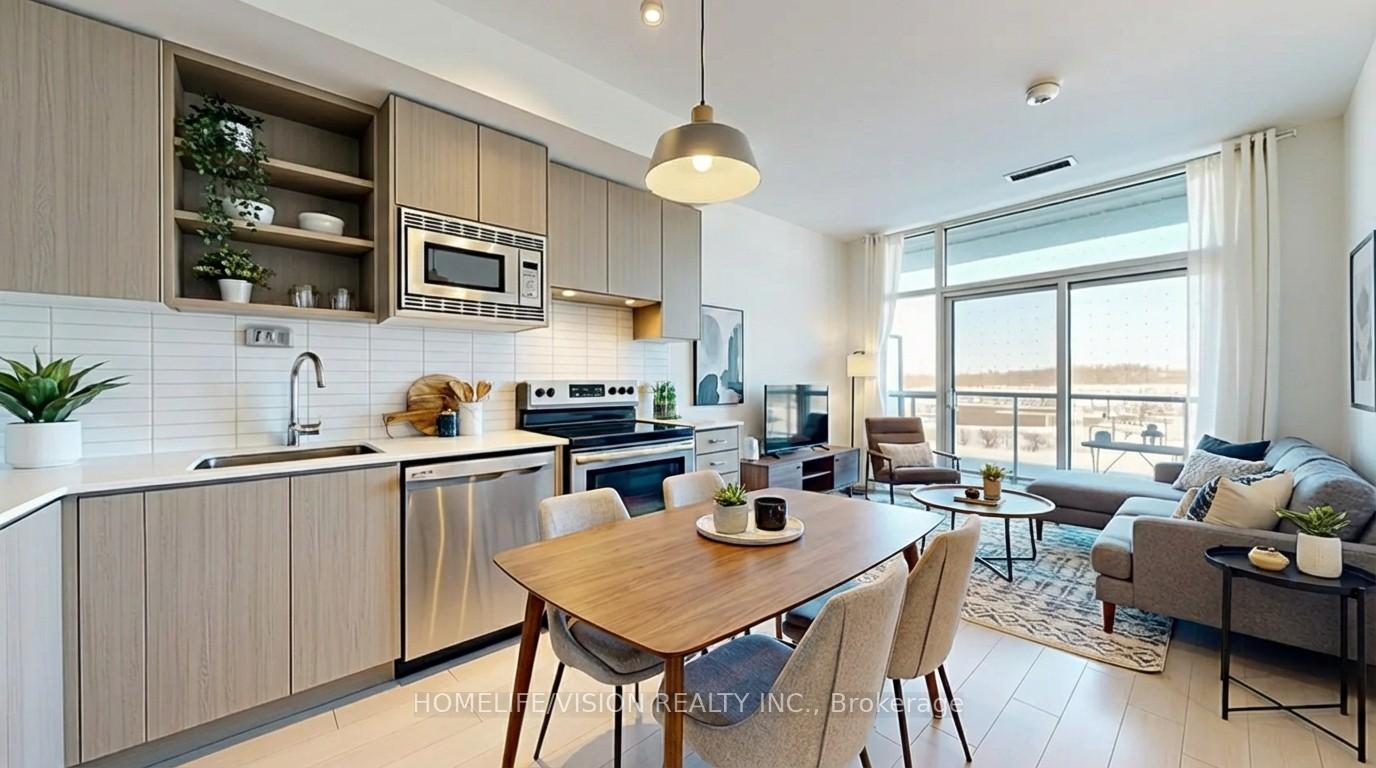
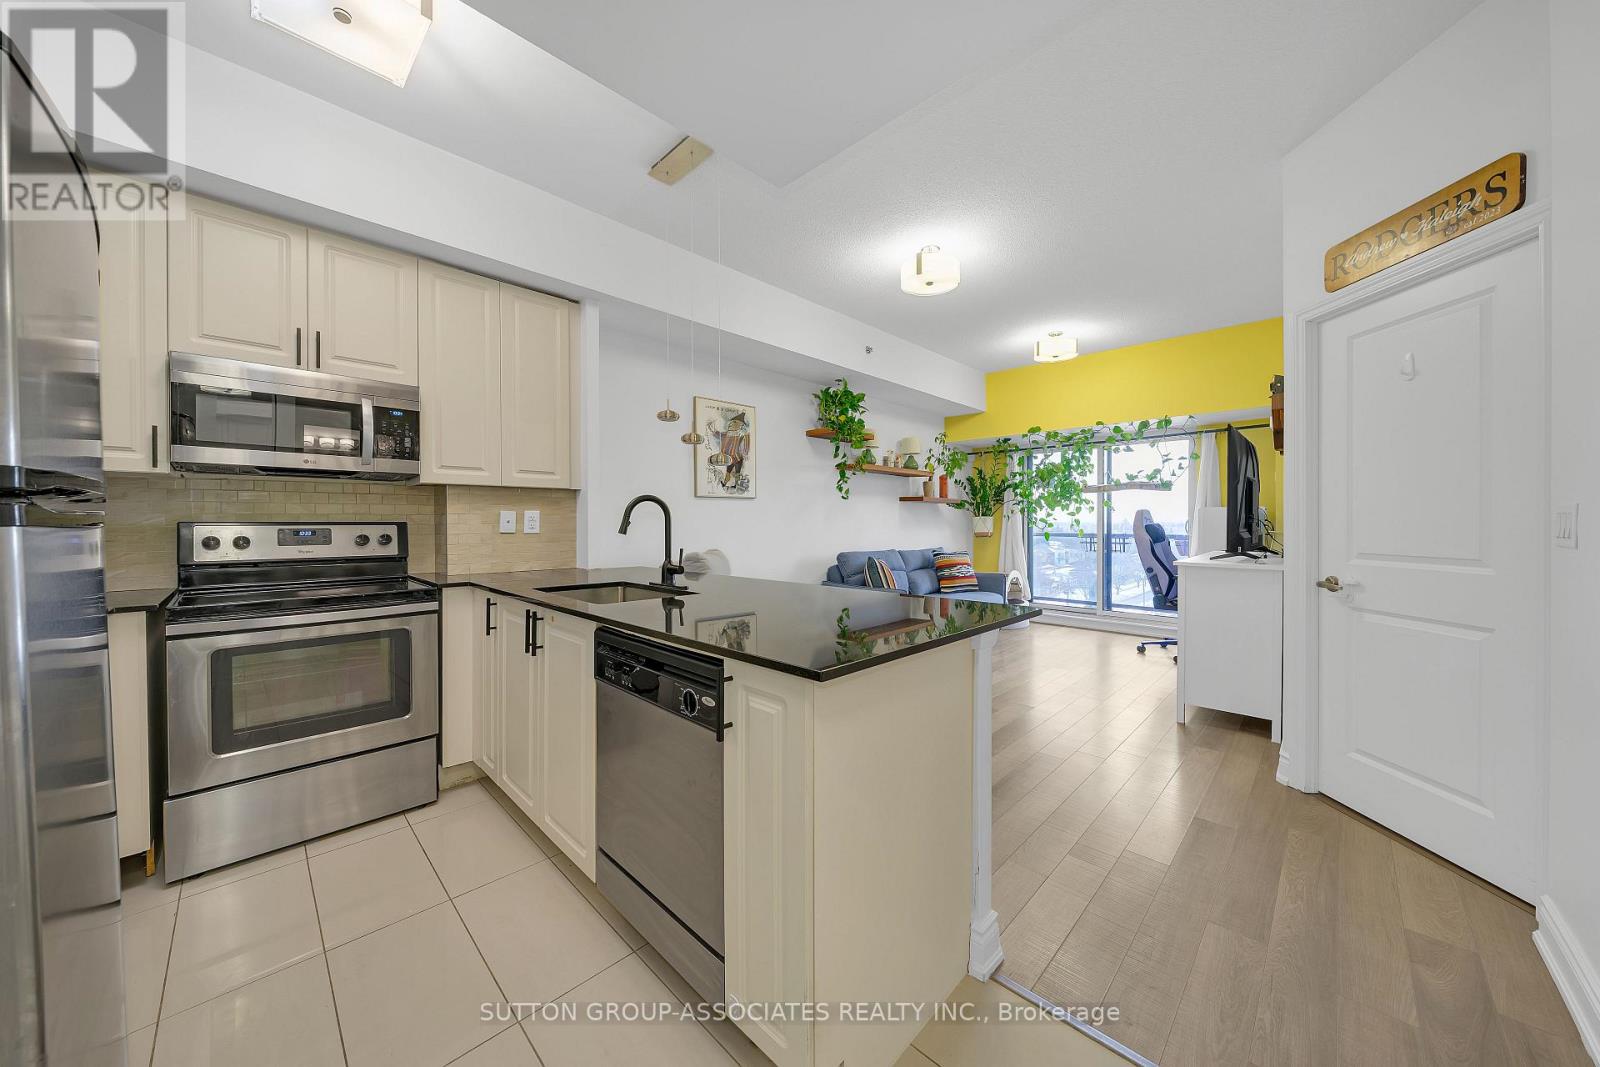
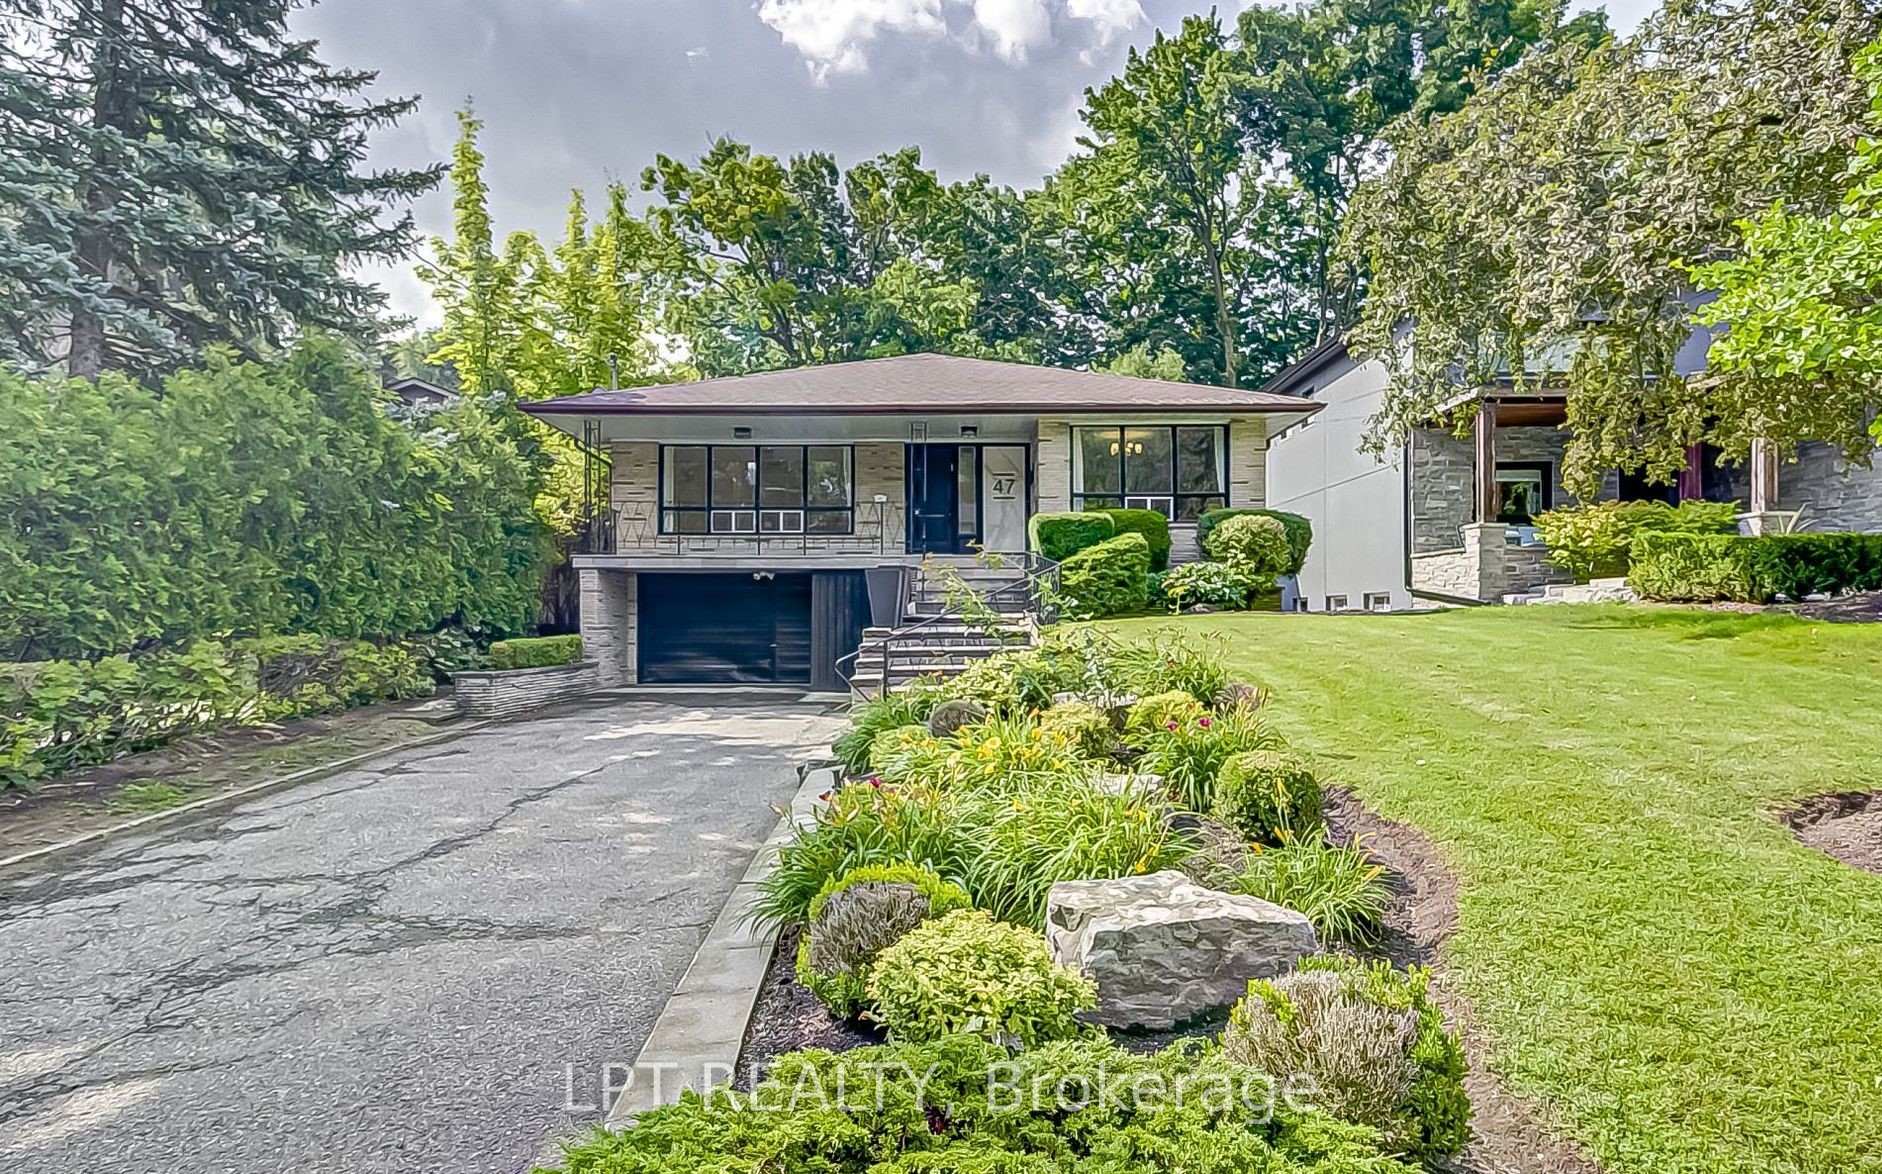
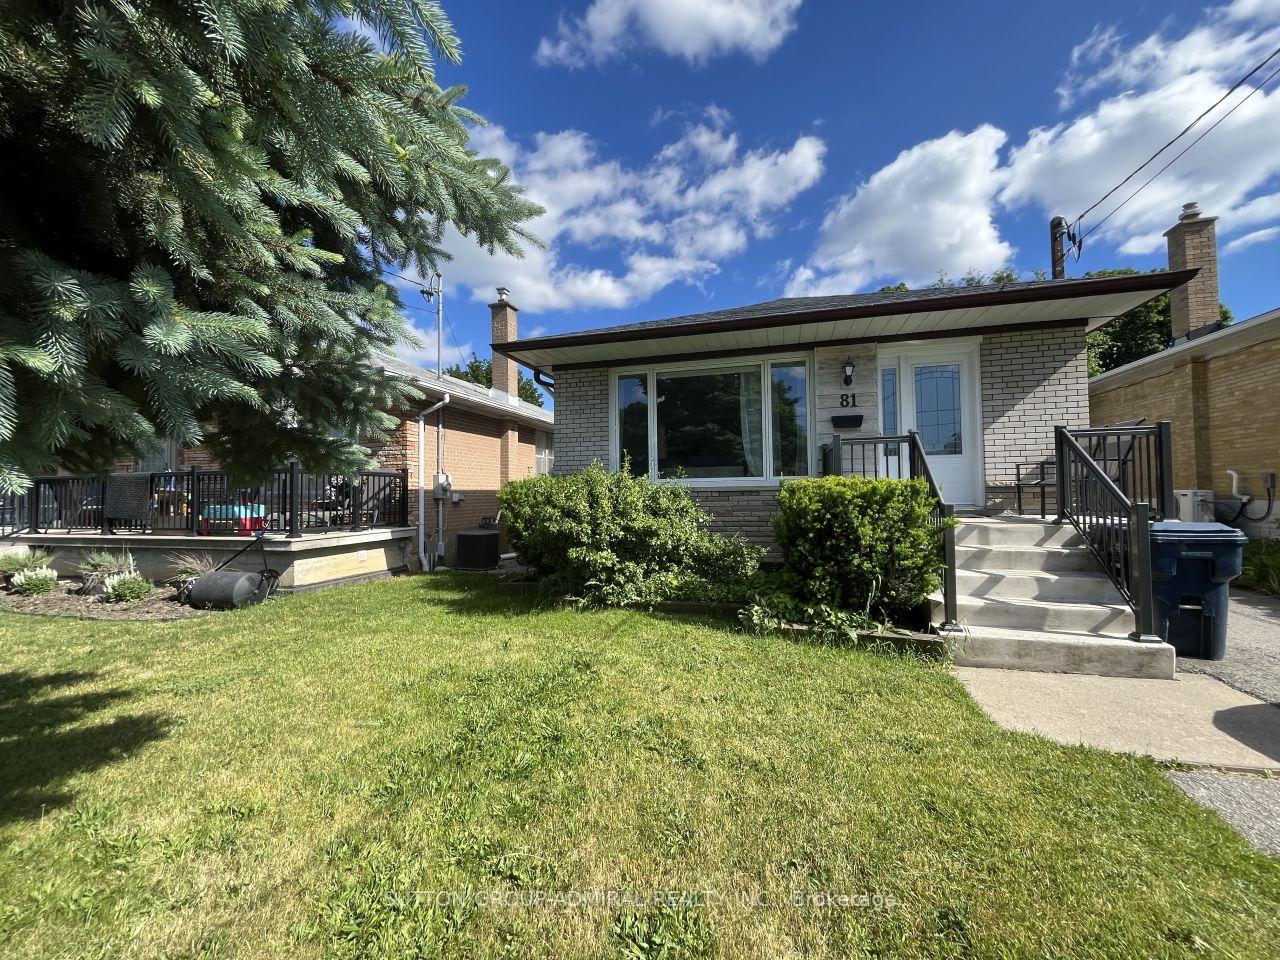
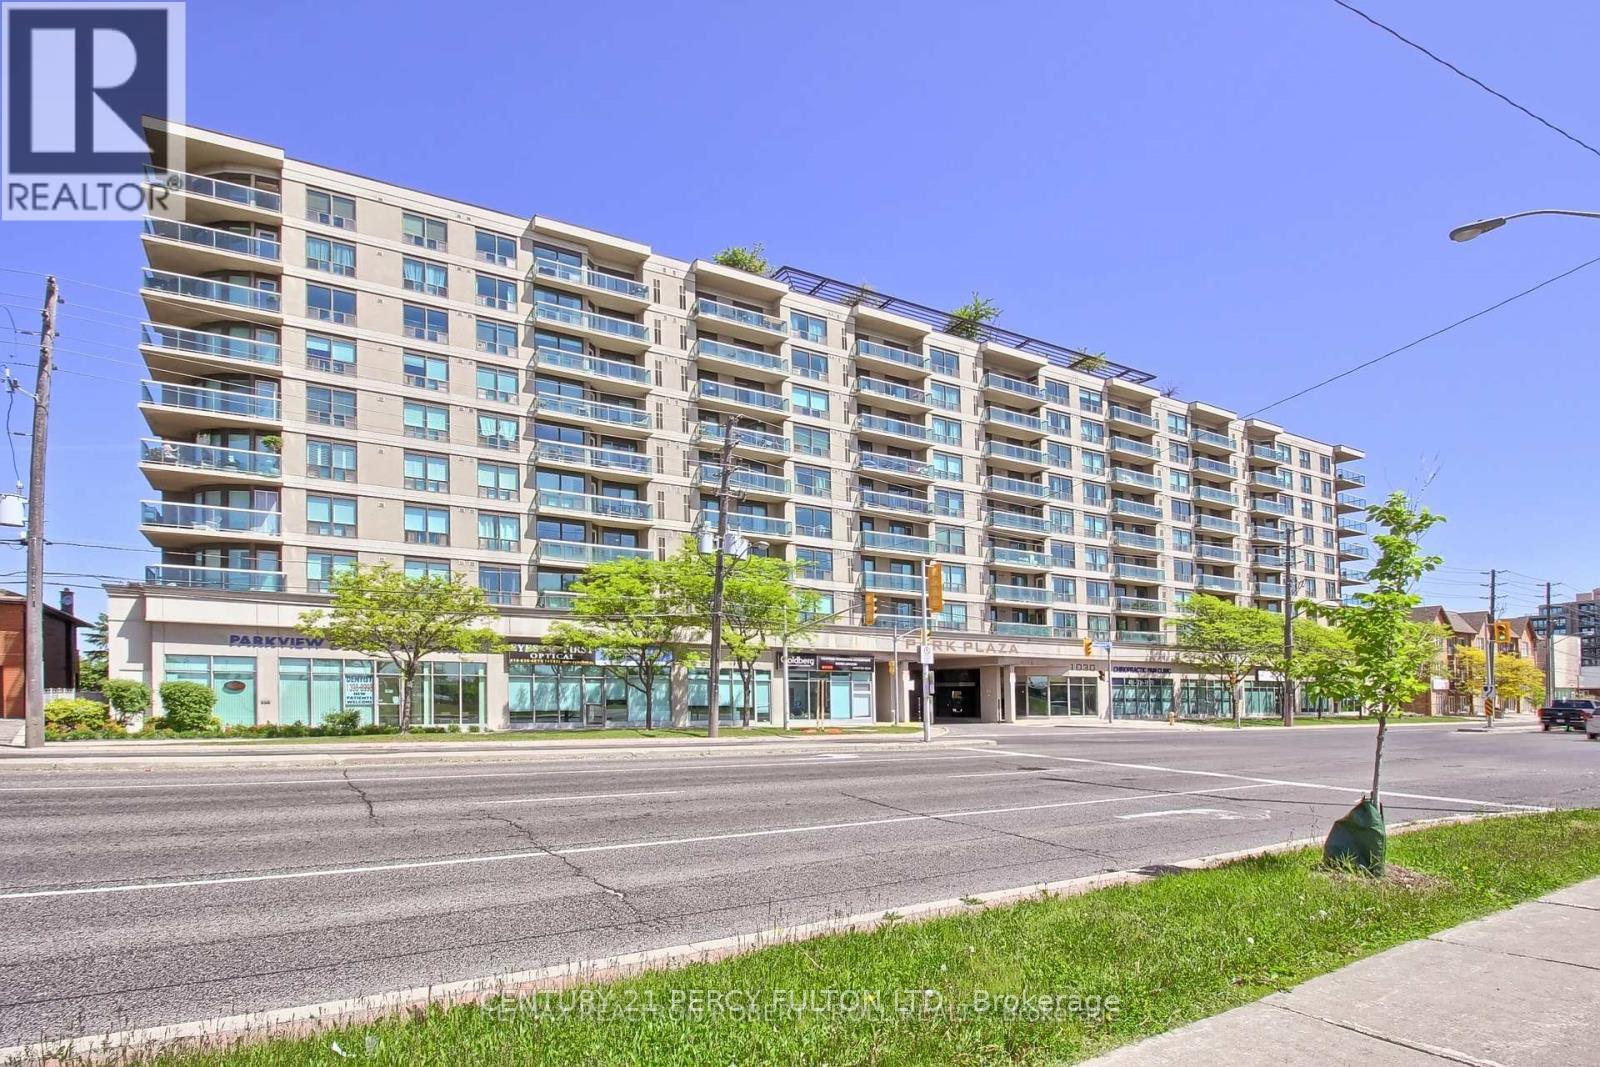
A beautiful neighbourhood in the heart of North Toronto, Bathurst Manor is an area blessed with tree-lined streets and expansive green space.
16,176 people live in Bathurst Manor, where the median age is 43 and the average individual income is $124,600. Data provided by Statistics Canada.
Total Population
Median Age
Population Density Population Density This is the number of people per square mile in a neighborhood.
Average individual Income
There's plenty to do around Bathurst Manor, including shopping, dining, nightlife, parks, and more. Data provided by Walk Score and Yelp.
Explore popular things to do in the area, including Coffee Time, Saint Laurent, and F45 Training.
| Name | Category | Distance | Reviews |
Ratings by
Yelp
|
|---|---|---|---|---|
| Dining · $$ | 1.84 miles | 1 review | 5/5 stars | |
| Shopping | 2.75 miles | 1 review | 5/5 stars | |
| Active | 2.21 miles | 2 reviews | 5/5 stars | |
| Beauty | 2.89 miles | 1 review | 5/5 stars | |
| Beauty | 4.84 miles | 1 review | 5/5 stars | |
|
|
||||
|
|
||||
|
|
||||
|
|
||||
|
|
||||
|
|
Bathurst Manor has 6,055 households, with an average household size of 3. Data provided by Statistics Canada. Here’s what the people living in Bathurst Manor do for work — and how long it takes them to get there. Data provided by Statistics Canada.
Total Population
Population Density Population Density This is the number of people per square mile in a neighborhood.
Median Age
Men vs Women
Population by Age Group
0-9 Years
10-17 Years
18-24 Years
25-64 Years
65-74 Years
75+ Years
Education Level
Total Households
Average Household Size
Average individual Income
Households with Children
With Children:
Without Children:
Marital Status
Blue vs White Collar Workers
Blue Collar:
White Collar:
Bathurst Manor has 6,055 households, with an average household size of 3. Data provided by Statistics Canada. Here’s what the people living in Bathurst Manor do for work — and how long it takes them to get there. Data provided by Statistics Canada. 16,176 people call Bathurst Manor home. The population density is 3 and the largest age group is Data provided by Statistics Canada.
Total Population
Population Density Population Density This is the number of people per square mile in a neighborhood.
Median Age
Population by Age Group
0-9 Years
10-19 Years
20-24 Years
25-64 Years
65-74 Years
75+ Years
Education Level
Total Households
Average Household Size
Average individual Income
Households with Children
With Children:
Without Children:
Marital Status
Blue vs White Collar Workers
Blue Collar:
White Collar: